Prometheus has integrations with many common service discovery mechanisms, such as Kubernetes, EC2,
and Consul. There is also a generic integration for those whose setup is a little off the beaten path (see
“File”).
This still leaves a problem though. Just because Prometheus has a list of machines and services doesn’t
mean we know how they fit into your architecture. For example, you might be using the EC2 Name tag
6
to
indicate what application runs on a machine, whereas others might use a tag called app .
As every organisation does it slightly differently, Prometheus allows you to configure how metadata from
service discovery is mapped to monitoring targets and their labels using relabelling.
Scraping
Service discovery and relabelling give us a list of targets to be monitored. Now Prometheus needs to fetch
the metrics. Prometheus does this by sending a HTTP request called a scrape. The response to the scrape is
parsed and ingested into storage. Several useful metrics are also added in, such as if the scrape succeeded
and how long it took. Scrapes happen regularly; usually you would configure it to happen every 10 to 60
seconds for each target.
PULL VERSUS PUSHPrometheus is a pull-based system. It decides when and what to scrape, based on its
configuration. There are also push-based systems, where the monitoring target decides if it is going to be
monitored and how often.There is vigorous debate online about the two designs, which often bears
similarities to debates around Vim versus EMACS. Suffice to say both have pros and cons, and overall it
doesn’t matter much.As a Prometheus user you should understand that pull is ingrained in the core of
Prometheus, and attempting to make it do push instead is at best unwise.
Storage
Prometheus stores data locally in a custom database. Distributed systems are challenging to make reliable,
so Prometheus does not attempt to do any form of clustering. In addition to reliability, this makes
Prometheus easier to run.
Over the years, storage has gone through a number of redesigns, with the storage system in Prometheus
2.0 being the third iteration. The storage system can handle ingesting millions of samples per second,
making it possible to monitor thousands of machines with a single Prometheus server. The compression
algorithm used can achieve 1.3 bytes per sample on real-world data. An SSD is recommended, but not
strictly required.
Dashboards
Prometheus has a number of HTTP APIs that allow you to both request raw data and evaluate PromQL
queries. These can be used to produce graphs and dashboards. Out of the box, Prometheus provides the
expression browser. It uses these APIs and is suitable for ad hoc querying and data exploration, but it is not a
general dashboard system.
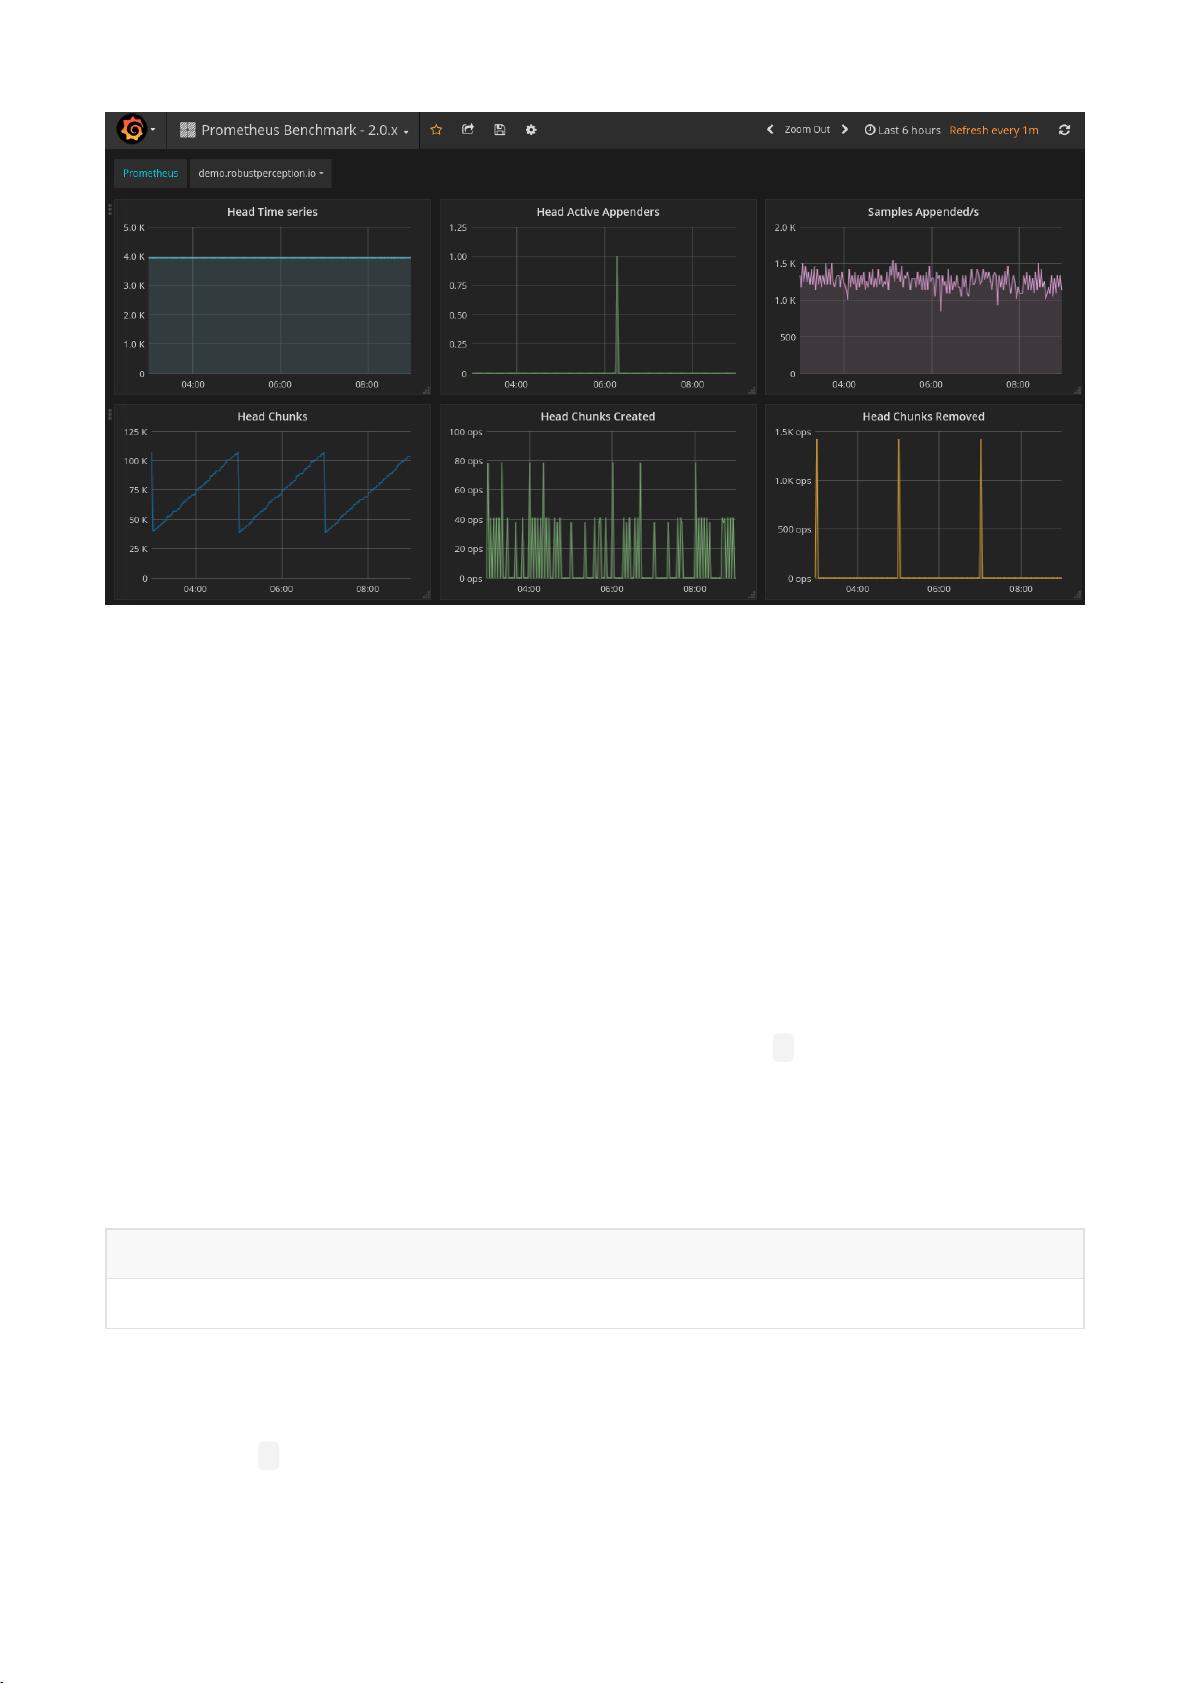
It is recommended that you use Grafana for dashboards. It has a wide variety of features, including official
support for Prometheus as a data source. It can produce a wide variety of dashboards, such as the one in
Figure 1-2. Grafana supports talking to multiple Prometheus servers, even within a single dashboard panel.
Figure 1-2. A Grafana dashboard


