导入数据后用随机森林10折交叉验证,最优超参数获得预测准确性
时间: 2024-06-08 10:01:26 浏览: 155
对于一个机器学习问题,一般需要进行以下步骤:
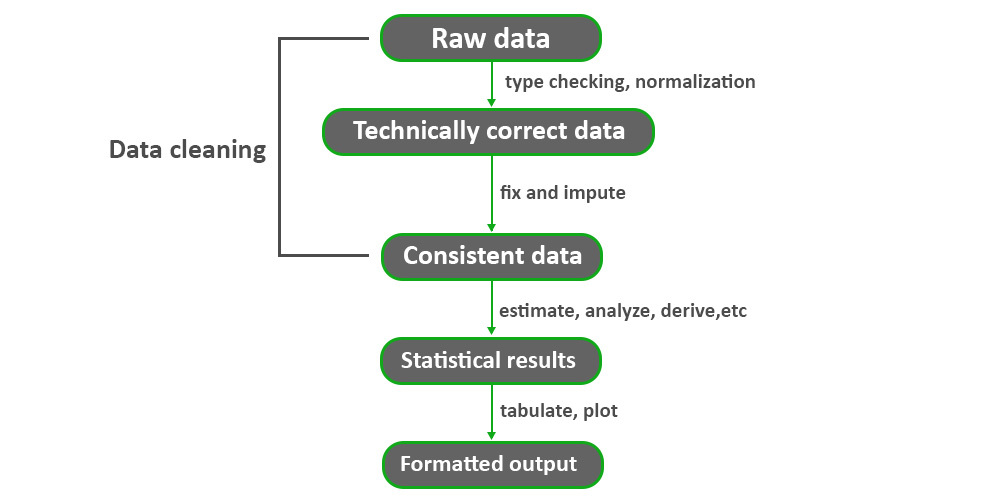
1. 数据预处理:包括数据清洗、特征提取、特征处理等步骤,将原始数据转换为可用于机器学习算法的形式。
2. 模型选择:根据问题的性质和数据的特点,选择合适的机器学习算法。
3. 超参数调优:对选定的模型进行超参数调优,以获得最优的模型性能。
4. 模型评估:使用测试集评估模型的性能。
针对您提出的问题,可以按照以下步骤进行处理:
1. 数据预处理:导入数据后,需要进行数据清洗、特征提取等操作,将数据转换为可用于机器学习算法的形式。
2. 模型选择:由于您的问题是一个分类问题,可以选择随机森林算法。随机森林是一种集成学习算法,可以有效地处理高维数据和非线性关系。
3. 超参数调优:随机森林有多个超参数需要调优,包括决策树数量、树的最大深度、叶子节点最小样本数等。可以使用网格搜索或随机搜索等方法寻找最优超参数组合。
4. 模型评估:使用10折交叉验证对模型进行评估,计算预测准确性。交叉验证可以有效地避免过拟合和欠拟合问题,提高模型的泛化能力。
最终,可以得到最优的随机森林模型和对应的预测准确性。
相关问题
怎么用随机森林十折交叉验证后输出最优超参数再用测试集测试python
可以使用sklearn库中的RandomizedSearchCV函数来进行随机森林的超参数优化和交叉验证。具体步骤如下:
1. 导入sklearn库:
```python
from sklearn.ensemble import RandomForestClassifier
from sklearn.model_selection import RandomizedSearchCV
from scipy.stats import randint
```
2. 定义随机森林分类器:
```python
rf = RandomForestClassifier()
```
3. 定义超参数的范围:
```python
param_distribs = {
'n_estimators': randint(low=1, high=200),
'max_features': randint(low=1, high=8),
}
```
4. 使用RandomizedSearchCV函数进行十折交叉验证和超参数优化:
```python
rnd_search = RandomizedSearchCV(rf, param_distributions=param_distribs,
n_iter=10, cv=10, scoring='accuracy', random_state=42)
rnd_search.fit(X_train, y_train)
```
5. 输出最优超参数:
```python
print("Best hyperparameters: ", rnd_search.best_params_)
```
6. 使用测试集测试模型:
```python
from sklearn.metrics import accuracy_score
y_pred = rnd_search.predict(X_test)
accuracy_score(y_test, y_pred)
```
注意,以上代码仅为示范,实际上要根据具体的数据集和问题进行适当的修改和调整。
随机森林交叉验证和超参数最优python
随机森林是一种基于决策树的集成学习算法,它通过随机选择特征和样本来构建多棵决策树,并将它们组合起来进行预测。随机森林可以用于分类和回归任务,具有很高的准确性和鲁棒性。
交叉验证是一种评估模型性能的方法,它将数据集分成若干份,每次使用其中一份作为测试集,其余作为训练集,多次重复这个过程,并将得到的结果进行平均,以得到更准确的评估结果。
超参数是机器学习算法中需要手动指定的参数,如随机森林中的树的数量、最大深度、最小叶子节点数等。超参数的选择会影响模型的性能,因此需要进行调参来找到最优的超参数组合。
在Python中,可以使用scikit-learn库来实现随机森林交叉验证和超参数最优化。具体步骤如下:
1. 导入所需的库和数据集。
```python
import numpy as np
import pandas as pd
from sklearn.ensemble import RandomForestClassifier
from sklearn.model_selection import cross_val_score, GridSearchCV
from sklearn.datasets import load_iris
iris = load_iris()
X = iris.data
y = iris.target
```
2. 创建随机森林模型,并进行交叉验证。
```python
rfc = RandomForestClassifier(n_estimators=100, random_state=42)
scores = cross_val_score(rfc, X, y, cv=5)
print("Accuracy: %0.2f (+/- %0.2f)" % (scores.mean(), scores.std() * 2))
```
3. 进行超参数调优,使用GridSearchCV来搜索最优的超参数组合。
```python
param_grid = {
"n_estimators": [50, 100, 200],
"max_depth": [3, 5, 7],
"min_samples_leaf": [1, 2, 4],
"max_features": ["sqrt", "log2"]
}
grid_search = GridSearchCV(rfc, param_grid=param_grid, cv=5)
grid_search.fit(X, y)
print("Best parameters: ", grid_search.best_params_)
print("Best score: ", grid_search.best_score_)
```
通过交叉验证和超参数调优,可以得到最优的随机森林模型,以及最优的超参数组合。
阅读全文
相关推荐
最新推荐
ARCore(Android的增强现实):ARCore性能优化与调试技巧.docx
ARCore(Android的增强现实):ARCore性能优化与调试技巧
停止维护 基于 ReactNative、Redux 的漫画.zip
停止维护 基于 ReactNative、Redux 的漫画
HIKVISION海康威视DS-7916N-E4 DS-7932N-E4录像机固件V3.4.106 build 200619
HIKVISION海康威视DS-7916N-E4 DS-7932N-E4硬盘录像机固件V3.4.106 build 200619版(2020年6月22日发布)
新版固件支持解绑萤石云功能。
注意:
设备升级有风险,请确认是否一定要升级设备。
请确认升级程序包是否适用于您的设备。
在设备升级过程中请勿断电。
2001-2023年上市公司企业平台生态嵌入数据含原始数据+计算代码+计算结果-最新出炉.zip
2001-2023年上市公司企业平台生态嵌入数据含原始数据+计算代码+计算结果-最新出炉.zip
基于SSM的四六级在线考试系统.zip
基于SSM的毕业设计源码
IEEE 14总线系统Simulink模型开发指南与案例研究
资源摘要信息:"IEEE 14 总线系统 Simulink 模型是基于 IEEE 指南而开发的,可以用于多种电力系统分析研究,比如短路分析、潮流研究以及互连电网问题等。模型具体使用了 MATLAB 这一数学计算与仿真软件进行开发,模型文件为 Fourteen_bus.mdl.zip 和 Fourteen_bus.zip,其中 .mdl 文件是 MATLAB 的仿真模型文件,而 .zip 文件则是为了便于传输和分发而进行的压缩文件格式。"
IEEE 14总线系统是电力工程领域中用于仿真实验和研究的基础测试系统,它是根据IEEE(电气和电子工程师协会)的指南设计的,目的是为了提供一个标准化的测试平台,以便研究人员和工程师可以比较不同的电力系统分析方法和优化技术。IEEE 14总线系统通常包括14个节点(总线),这些节点通过一系列的传输线路和变压器相互连接,以此来模拟实际电网中各个电网元素之间的电气关系。
Simulink是MATLAB的一个附加产品,它提供了一个可视化的环境用于模拟、多域仿真和基于模型的设计。Simulink可以用来模拟各种动态系统,包括线性、非线性、连续时间、离散时间以及混合信号系统,这使得它非常适合电力系统建模和仿真。通过使用Simulink,工程师可以构建复杂的仿真模型,其中就包括了IEEE 14总线系统。
在电力系统分析中,短路分析用于确定在特定故障条件下电力系统的响应。了解短路电流的大小和分布对于保护设备的选择和设置至关重要。潮流研究则关注于电力系统的稳态操作,通过潮流计算可以了解在正常运行条件下各个节点的电压幅值、相位和系统中功率流的分布情况。
在进行互连电网问题的研究时,IEEE 14总线系统也可以作为一个测试案例,研究人员可以通过它来分析电网中的稳定性、可靠性以及安全性问题。此外,它也可以用于研究分布式发电、负载管理和系统规划等问题。
将IEEE 14总线系统的模型文件打包为.zip格式,是一种常见的做法,以减小文件大小,便于存储和传输。在解压.zip文件之后,用户就可以获得包含所有必要组件的完整模型文件,进而可以在MATLAB的环境中加载和运行该模型,进行上述提到的多种电力系统分析。
总的来说,IEEE 14总线系统 Simulink模型提供了一个有力的工具,使得电力系统的工程师和研究人员可以有效地进行各种电力系统分析与研究,并且Simulink模型文件的可复用性和可视化界面大大提高了工作的效率和准确性。
管理建模和仿真的文件
管理Boualem Benatallah引用此版本:布阿利姆·贝纳塔拉。管理建模和仿真。约瑟夫-傅立叶大学-格勒诺布尔第一大学,1996年。法语。NNT:电话:00345357HAL ID:电话:00345357https://theses.hal.science/tel-003453572008年12月9日提交HAL是一个多学科的开放存取档案馆,用于存放和传播科学研究论文,无论它们是否被公开。论文可以来自法国或国外的教学和研究机构,也可以来自公共或私人研究中心。L’archive ouverte pluridisciplinaire
【数据安全黄金法则】:R语言中party包的数据处理与隐私保护
# 1. 数据安全黄金法则与R语言概述
在当今数字化时代,数据安全已成为企业、政府机构以及个人用户最为关注的问题之一。数据安全黄金法则,即最小权限原则、加密保护和定期评估,是构建数据保护体系的基石。通过这一章节,我们将介绍R语言——一个在统计分析和数据科学领域广泛应用的编程语言,以及它在实现数据安全策略中所能发挥的独特作用。
## 1.1 R语言简介
R语言是一种
Takagi-Sugeno模糊控制方法的原理是什么?如何设计一个基于此方法的零阶或一阶模糊控制系统?
Takagi-Sugeno模糊控制方法是一种特殊的模糊推理系统,它通过一组基于规则的模糊模型来逼近系统的动态行为。与传统的模糊控制系统相比,该方法的核心在于将去模糊化过程集成到模糊推理中,能够直接提供系统的精确输出,特别适合于复杂系统的建模和控制。
参考资源链接:[Takagi-Sugeno模糊控制原理与应用详解](https://wenku.csdn.net/doc/2o97444da0?spm=1055.2569.3001.10343)
零阶Takagi-Sugeno系统通常包含基于规则的决策,它不包含系统的动态信息,适用于那些系统行为可以通过一组静态的、非线性映射来描述的场合。而一阶
STLinkV2.J16.S4固件更新与应用指南
资源摘要信息:"STLinkV2.J16.S4固件.zip包含了用于STLinkV2系列调试器的JTAG/SWD接口固件,具体版本为J16.S4。固件文件的格式为二进制文件(.bin),适用于STMicroelectronics(意法半导体)的特定型号的调试器,用于固件升级或更新。"
STLinkV2.J16.S4固件是指针对STLinkV2系列调试器的固件版本J16.S4。STLinkV2是一种常用于编程和调试STM32和STM8微控制器的调试器,由意法半导体(STMicroelectronics)生产。固件是指嵌入在设备硬件中的软件,负责执行设备的低级控制和管理任务。
固件版本J16.S4中的"J16"可能表示该固件的修订版本号,"S4"可能表示次级版本或是特定于某个系列的固件。固件版本号可以用来区分不同时间点发布的更新和功能改进,开发者和用户可以根据需要选择合适的版本进行更新。
通常情况下,固件升级可以带来以下好处:
1. 增加对新芯片的支持:随着新芯片的推出,固件升级可以使得调试器能够支持更多新型号的微控制器。
2. 提升性能:修复已知的性能问题,提高设备运行的稳定性和效率。
3. 增加新功能:可能包括对调试协议的增强,或是新工具的支持。
4. 修正错误:对已知错误进行修正,提升调试器的兼容性和可靠性。
使用STLinkV2.J16.S4固件之前,用户需要确保固件与当前的硬件型号兼容。更新固件的步骤大致如下:
1. 下载固件文件STLinkV2.J16.S4.bin。
2. 打开STLink的软件更新工具(可能是ST-Link Utility),该工具由STMicroelectronics提供,用于管理固件更新过程。
3. 通过软件将下载的固件文件导入到调试器中。
4. 按照提示完成固件更新过程。
在进行固件更新之前,强烈建议用户仔细阅读相关的更新指南和操作手册,以避免因操作不当导致调试器损坏。如果用户不确定如何操作,应该联系设备供应商或专业技术人员进行咨询。
固件更新完成后,用户应该检查调试器是否能够正常工作,并通过简单的测试项目验证固件的功能是否正常。如果存在任何问题,应立即停止使用并联系技术支持。
固件文件通常位于STMicroelectronics官方网站或专门的软件支持平台上,用户可以在这里下载最新的固件文件,以及获得技术支持和更新日志。STMicroelectronics网站上还会提供固件更新工具,它是更新固件的必备工具。
由于固件涉及到硬件设备的底层操作,错误的固件升级可能会导致设备变砖(无法使用)。因此,在进行固件更新之前,用户应确保了解固件更新的风险,备份好重要数据,并在必要时寻求专业帮助。