univariate analysis
时间: 2023-05-01 19:03:18 浏览: 179
'univariate analysis' 意思是“单变量分析”。它是指只考虑一个自变量或一个因变量的统计分析方法,主要用于描述数据、探究变量之间的关系和探索数据的分布情况等。常见的单变量分析方法包括描述性统计、频率分布、柱形图等。
相关问题
follow the step give me code and explan it :Forest Cover Type Prediction We shall follow the following steps to complete this challange: Understand the business problem Get the data Discover and visualize insights (univariate and multi variate analysis) Prepare data for ML algorithms Select a model and train it Fine tune your model Launch, monitor and maintain your system (not needed in this case).
Sure, here are the steps along with code explanations:
1. Understand the business problem:
This step involves understanding the problem statement and the objective of the competition. In the case of the Kaggle Forest Cover Type Prediction competition, the objective is to predict the type of forest cover (out of 7 possible types) based on various geographical features like elevation, slope, aspect, etc.
2. Get the data:
The data for this competition can be downloaded from the Kaggle website. It contains both training and testing datasets.
3. Discover and visualize insights:
In this step, we perform exploratory data analysis (EDA) to gain insights into the data. This involves plotting various visualizations like histograms, scatter plots, heat maps, etc. to understand the distribution of the data and the relationships between different features.
4. Prepare data for ML algorithms:
In this step, we preprocess the data to make it suitable for machine learning algorithms. This involves tasks like handling missing values, encoding categorical variables, scaling numerical features, etc.
5. Select a model and train it:
In this step, we select a suitable machine learning model based on the characteristics of the data and the problem statement. We then train the model on the preprocessed data.
6. Fine tune your model:
In this step, we try to improve the performance of the model by fine-tuning its hyperparameters. This involves using techniques like grid search, random search, and Bayesian optimization to find the optimal set of hyperparameters.
7. Launch, monitor and maintain your system:
This step is not relevant for this competition.
Here is some sample Python code for the first few steps:
```python
import pandas as pd
import numpy as np
import matplotlib.pyplot as plt
import seaborn as sns
# Load the data
train_df = pd.read_csv('train.csv')
test_df = pd.read_csv('test.csv')
# Explore the data
print(train_df.head())
# Visualize the target variable
sns.countplot(x='Cover_Type', data=train_df)
plt.show()
# Preprocess the data
from sklearn.preprocessing import StandardScaler
# Drop unnecessary columns
train_df.drop(['Id', 'Soil_Type7', 'Soil_Type15'], axis=1, inplace=True)
test_df.drop(['Id', 'Soil_Type7', 'Soil_Type15'], axis=1, inplace=True)
# Split the data into features and labels
X_train = train_df.drop(['Cover_Type'], axis=1)
y_train = train_df['Cover_Type']
# Scale the features
scaler = StandardScaler()
X_train = scaler.fit_transform(X_train)
```
Note that this code is just a sample and may need to be modified based on the specific requirements of the competition and the characteristics of the data.
spss componentmatrix
根据提供的引用内容,SPSS中的componentmatrix是指成分矩阵,它用于计算因素载荷平方和、公因子方差比和共同度。成分矩阵针对每道题而言,旋转与否无差异。
以下是SPSS中componentmatrix的一些相关操作和示例:
1. 计算因素载荷平方和:
```spss
FACTOR
/VARIABLES = var1 var2 var3
/MISSING = LISTWISE
/ANALYSIS var1 var2 var3
/PRINT UNIVARIATE INITIAL CORRELATION
/PLOT EIGEN
/CRITERIA FACTORS(2)
/EXTRACTION ML
/ROTATION NOROTATE.
```
2. 计算公因子方差比:
```spss
FACTOR
/VARIABLES = var1 var2 var3
/MISSING = LISTWISE
/ANALYSIS var1 var2 var3
/PRINT UNIVARIATE INITIAL CORRELATION
/PLOT EIGEN
/CRITERIA FACTORS(2)
/EXTRACTION ML
/ROTATION NOROTATE
/SAVE REGRESSION
/METHOD=CORRELATION.
```
3. 计算共同度:
```spss
FACTOR
/VARIABLES = var1 var2 var3
/MISSING = LISTWISE
/ANALYSIS var1 var2 var3
/PRINT UNIVARIATE INITIAL CORRELATION
/PLOT EIGEN
/CRITERIA FACTORS(2)
/EXTRACTION ML
/ROTATION NOROTATE
/SAVE REGRESSION
/METHOD=REGRESSION.
```
相关推荐
最新推荐
sas各过程笔记 描述性统计 线性回归 logistic回归 生存分析 判别分析 聚类分析 主成分分析 因子分析 典型相关分析
Univariate 过程用于计算变量的单变量统计量,例如(proc univariate data=ex2_1; var x; run;),可以计算变量 x 的均值、标准差、标准误、置信区间等。 正态检验 正态检验用于检验变量是否服从正态分布。SAS 中...
Seaborn中文用户指南.docx
- **Univariate distributions**可以使用`distplot()`、`kdeplot()`或`histplot()`来展示单变量的分布。 - **Bivariate distributions**如联合分布或边际分布,可以使用`jointplot()`或`pairplot()`。 - **...
Awesome_mixins-0.4-py2-none-any.whl.zip
Awesome_mixins-0.4-py2-none-any.whl.zip
多模态联合稀疏表示在视频目标跟踪中的应用
"该资源是一篇关于多模态联合稀疏表示在视频目标跟踪中的应用的学术论文,由段喜萍、刘家锋和唐降龙撰写,发表在中国科技论文在线。文章探讨了在复杂场景下,如何利用多模态特征提高目标跟踪的精度,提出了联合稀疏表示的方法,并在粒子滤波框架下进行了实现。实验结果显示,这种方法相比于单模态和多模态独立稀疏表示的跟踪算法,具有更高的精度。"
在计算机视觉领域,视频目标跟踪是一项关键任务,尤其在复杂的环境条件下,如何准确地定位并追踪目标是一项挑战。传统的单模态特征,如颜色、纹理或形状,可能不足以区分目标与背景,导致跟踪性能下降。针对这一问题,该论文提出了基于多模态联合稀疏表示的跟踪策略。
联合稀疏表示是一种将不同模态的特征融合在一起,以增强表示的稳定性和鲁棒性的方式。在该方法中,作者考虑到了分别对每种模态进行稀疏表示可能导致的不稳定性,以及不同模态之间的相关性。他们采用粒子滤波框架来实施这一策略,粒子滤波是一种递归的贝叶斯方法,适用于非线性、非高斯状态估计问题。
在跟踪过程中,每个粒子代表一种可能的目标状态,其多模态特征被联合稀疏表示,以促使所有模态特征产生相似的稀疏模式。通过计算粒子的各模态重建误差,可以评估每个粒子的观察概率。最终,选择观察概率最大的粒子作为当前目标状态的估计。这种方法的优势在于,它不仅结合了多模态信息,还利用稀疏表示提高了特征区分度,从而提高了跟踪精度。
实验部分对比了基于本文方法与其他基于单模态和多模态独立稀疏表示的跟踪算法,结果证实了本文方法在精度上的优越性。这表明,多模态联合稀疏表示在处理复杂场景的目标跟踪时,能有效提升跟踪效果,对于未来的研究和实际应用具有重要的参考价值。
关键词涉及的领域包括计算机视觉、目标跟踪、粒子滤波和稀疏表示,这些都是视频分析和模式识别领域的核心概念。通过深入理解和应用这些技术,可以进一步优化目标检测和跟踪算法,适应更广泛的环境和应用场景。
管理建模和仿真的文件
管理Boualem Benatallah引用此版本:布阿利姆·贝纳塔拉。管理建模和仿真。约瑟夫-傅立叶大学-格勒诺布尔第一大学,1996年。法语。NNT:电话:00345357HAL ID:电话:00345357https://theses.hal.science/tel-003453572008年12月9日提交HAL是一个多学科的开放存取档案馆,用于存放和传播科学研究论文,无论它们是否被公开。论文可以来自法国或国外的教学和研究机构,也可以来自公共或私人研究中心。L’archive ouverte pluridisciplinaire
文本摘要革命:神经网络如何简化新闻制作流程
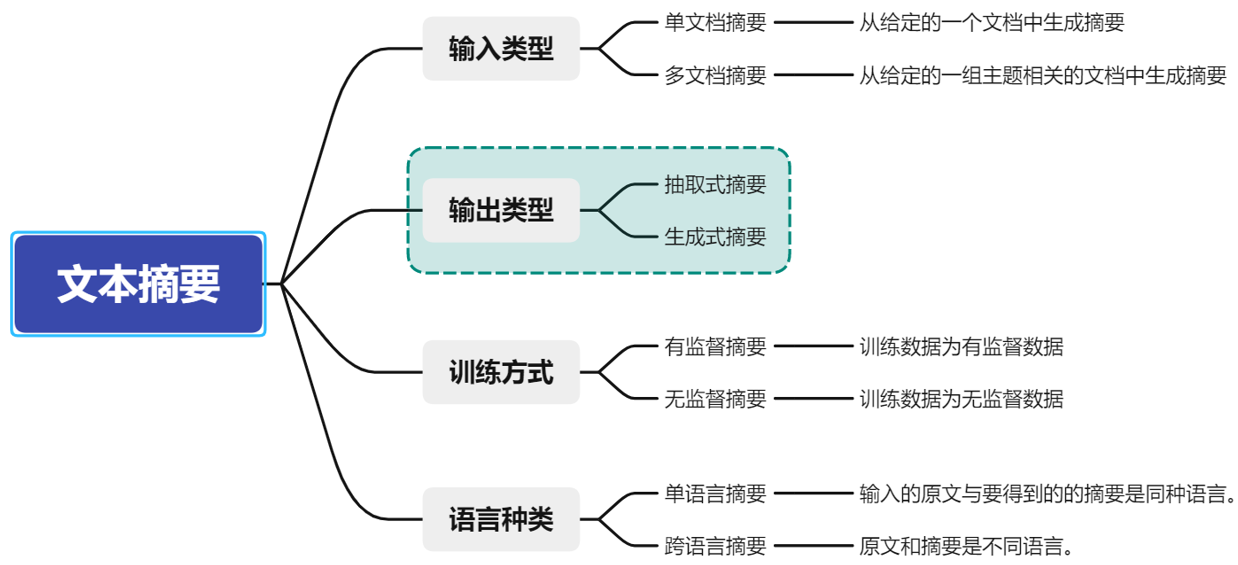
# 1. 文本摘要与新闻制作的交汇点
在信息技术高速发展的今天,自动化新闻生成已成为可能,尤其在文本摘要领域,它将新闻制作的效率和精准度推向了新的高度。文本摘要作为信息提取和内容压缩的重要手段,对于新闻制作来说,其价值不言而喻。它不仅能快速提炼新闻要点,而且能够辅助新闻编辑进行内容筛选,减轻人力负担。通过深入分析文本摘要与新闻制作的交汇点,本章将从文本摘要的基础概念出发,进一步探讨它在新闻制作中的具体应用和优化策
日本南开海槽砂质沉积物粒径级配曲线
日本南开海槽是位于日本海的一个地质构造,其砂质沉积物的粒径级配曲线是用来描述该区域砂质沉积物中不同粒径颗粒的相对含量。粒径级配曲线通常是通过粒度分析得到的,它能反映出沉积物的粒度分布特征。
在绘制粒径级配曲线时,横坐标一般表示颗粒的粒径大小,纵坐标表示小于或等于某一粒径的颗粒的累计百分比。通过这样的曲线,可以直观地看出沉积物的粒度分布情况。粒径级配曲线可以帮助地质学家和海洋学家了解沉积环境的变化,比如水动力条件、沉积物来源和搬运过程等。
通常,粒径级配曲线会呈现出不同的形状,如均匀分布、正偏态、负偏态等。这些不同的曲线形状反映了沉积物的不同沉积环境和动力学特征。在南开海槽等深海环境中,沉积
Kubernetes资源管控与Gardener开源软件实践解析
"Kubernetes资源管控心得与Gardener开源软件资料下载.pdf"
在云计算领域,Kubernetes已经成为管理容器化应用程序的事实标准。然而,随着集群规模的扩大,资源管控变得日益复杂,这正是卢震宇,一位拥有丰富经验的SAP云平台软件开发经理,分享的主题。他强调了在Kubernetes环境中进行资源管控的心得体会,并介绍了Gardener这一开源项目,旨在解决云原生应用管理中的挑战。
在管理云原生应用时,企业面临诸多问题。首先,保持Kubernetes集群的更新和安全补丁安装是基础但至关重要的任务,这关系到系统的稳定性和安全性。其次,节点操作系统维护同样不可忽视,确保所有组件都能正常运行。再者,多云策略对于贴近客户、提供灵活部署选项至关重要。此外,根据负载自动扩展能力是现代云基础设施的必备功能,能够确保资源的有效利用。最后,遵循安全最佳实践,防止潜在的安全威胁,是保障业务连续性的关键。
为了解决这些挑战,Gardener项目应运而生。Gardener是一个基于Kubernetes构建的服务,它遵循“用Kubernetes管理一切”的原则,扩展了Kubernetes API服务器的功能,使得管理数千个企业级Kubernetes集群变得可能。通过Gardener,可以实现自动化升级、安全管理和跨云操作,大大减轻了Day2操作的复杂性。
Gardener的核心特性包括:
1. 自动化运维:Gardener能够自动化处理集群的生命周期管理,如创建、扩展、更新和删除。
2. 集群一致性:确保所有集群都遵循统一的标准和最佳实践,无论它们位于哪个云提供商之上。
3. 弹性伸缩:根据工作负载自动调整集群规模,以优化资源利用率。
4. 跨云支持:支持多云策略,帮助企业灵活地在不同云环境之间迁移。
5. 安全性:内置安全机制,确保集群及其应用程序的安全运行。
通过学习卢震宇分享的资料和深入理解Gardener项目,IT专业人员能够更好地应对Kubernetes资源管控的挑战,提升云原生应用的运营效率和可靠性。Gardener不仅是一个工具,更是一种方法论,它推动了Kubernetes在大规模企业环境中的落地和普及。
"互动学习:行动中的多样性与论文攻读经历"
多样性她- 事实上SCI NCES你的时间表ECOLEDO C Tora SC和NCESPOUR l’Ingén学习互动,互动学习以行动为中心的强化学习学会互动,互动学习,以行动为中心的强化学习计算机科学博士论文于2021年9月28日在Villeneuve d'Asq公开支持马修·瑟林评审团主席法布里斯·勒菲弗尔阿维尼翁大学教授论文指导奥利维尔·皮耶昆谷歌研究教授:智囊团论文联合主任菲利普·普雷教授,大学。里尔/CRISTAL/因里亚报告员奥利维耶·西格德索邦大学报告员卢多维奇·德诺耶教授,Facebook /索邦大学审查员越南圣迈IMT Atlantic高级讲师邀请弗洛里安·斯特鲁布博士,Deepmind对于那些及时看到自己错误的人...3谢谢你首先,我要感谢我的两位博士生导师Olivier和Philippe。奥利维尔,"站在巨人的肩膀上"这句话对你来说完全有意义了。从科学上讲,你知道在这篇论文的(许多)错误中,你是我可以依
递归神经网络(RNN):揭秘语言模型背后的革命力量
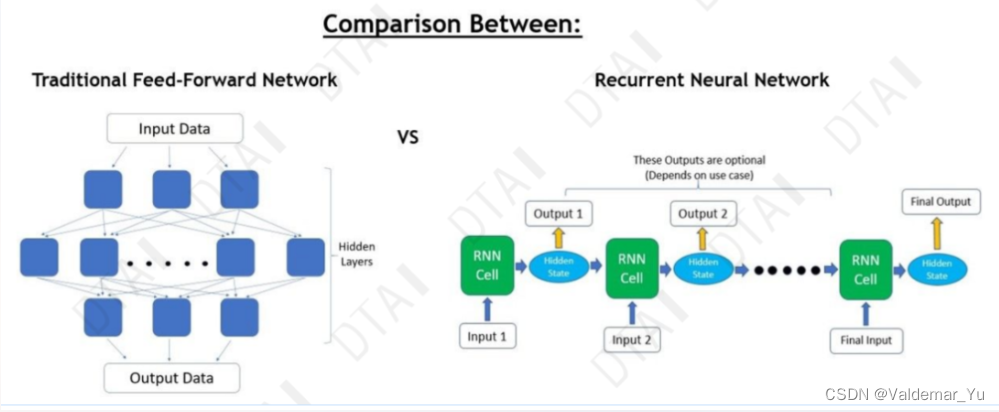
# 1. 递归神经网络基础与原理
## 1.1 递归神经网络简介
递归神经网络(RNN)是深度学习领域中的一种核心神经网络架构,它能够处理序列数据。与传统的前馈神经网络不同,RNN具有记忆功能,通过循环连接在时间上存储信息,这使得它特别适合处理时间序列数据,如语言、音频、视频等。
## 1.2 RNN的工作机制
RNN的工作原理是通过时间步序列展开,每一个时间步都使用相同的参数进行前向传播,这使得网