MATLAB聚类分析:掌握步骤与提升分析技巧
发布时间: 2024-08-31 02:58:54 阅读量: 85 订阅数: 48 

聚类分析MATLAB.pdf.zip
# 1. MATLAB聚类分析简介
聚类分析是数据挖掘中的一项核心技术,它通过将数据集划分为多个组或“簇”,使得组内的数据点相似度高,而组间的数据点相似度低。MATLAB作为一种高性能的数值计算和可视化软件,提供了丰富的工具箱支持聚类分析,使其成为科研、工程以及数据分析中处理聚类问题的有力工具。本章将简要介绍MATLAB聚类分析的基本概念、常用算法以及在实际应用中的价值。
本章的主要内容包括:
- 聚类分析的基本概念和应用场景
- MATLAB中聚类分析工具箱的概述
- 聚类分析在MATLAB中的初步使用方法
在接下来的章节中,我们将逐步深入到数据预处理、基本聚类算法、高级聚类技术和聚类分析实践案例等主题,直至最终掌握在MATLAB环境下进行高效聚类分析的进阶技巧。
# 2. 数据预处理与准备
数据预处理是聚类分析中不可或缺的一环,它的目的是确保数据质量,使得后续的分析能够顺利进行并得到有意义的结果。本章节将详细介绍数据收集与整理、数据标准化与归一化、数据特征选择与降维的方法。
### 2.1 数据收集与整理
#### 2.1.1 数据来源及采集方式
在进行聚类分析之前,首先需要确定数据的来源以及数据的采集方式。数据来源可以多样,例如可以直接从公司数据库中提取,也可以通过在线问卷调查、用户日志文件等方式获得。数据采集方式通常涉及编程爬虫技术,或者通过API直接获取。关键点在于保证数据的准确性和完整性。
```matlab
% 示例:从CSV文件中读取数据
filename = 'data.csv';
data = csvread(filename);
```
#### 2.1.2 数据清洗与初步整理
获得初步数据后,接下来就是数据清洗和整理的过程。数据清洗包括去除重复记录、处理缺失值、纠正错误值等。初步整理则可能涉及数据类型的转换、记录的排序以及转换为适合聚类分析的格式。
```matlab
% 示例:数据清洗 - 处理缺失值
% 假设 'data' 是一个矩阵,且第一列是标识列,其余列为数据
cleanedData = data;
for i = 2:size(data, 2)
cleanedData(:, i) = fillmissing(data(:, i), 'linear');
end
```
### 2.2 数据标准化与归一化
#### 2.2.1 标准化方法的理论基础
数据标准化和归一化的目的是解决不同变量间量纲不一致的问题。标准化是将数据按比例缩放,使之落入一个小的特定区间,常见的有Z-Score标准化。而归一化则是将数据缩放到一个固定区间,通常为[0,1]。
```matlab
% 示例:Z-Score标准化
meanVector = mean(cleanedData(:, 2:end), 1);
stdVector = std(cleanedData(:, 2:end), 0, 1);
normalizedData = (cleanedData(:, 2:end) - meanVector) ./ stdVector;
```
#### 2.2.2 归一化的应用实例
归一化通常用于数据压缩或在神经网络输入输出层的处理。在聚类分析中,通过归一化可以提高算法的效率和准确性。
```matlab
% 示例:Min-Max归一化
minVals = min(cleanedData(:, 2:end), [], 1);
maxVals = max(cleanedData(:, 2:end), [], 1);
normalizedData = (cleanedData(:, 2:end) - minVals) ./ (maxVals - minVals);
```
### 2.3 数据特征选择与降维
#### 2.3.1 特征选择的重要性
在处理具有多维特征的数据集时,特征选择是一个关键步骤。通过特征选择可以剔除不相关或冗余的特征,降低模型复杂度,并可能提高聚类分析的准确度。
#### 2.3.2 降维技术的种类与应用
降维技术用于减少数据集中的特征数量。常用的方法包括主成分分析(PCA)和线性判别分析(LDA)。以下是PCA在MATLAB中应用的一个例子:
```matlab
% 示例:使用PCA进行降维
[coeff, score, latent] = pca(normalizedData);
reducedData = score(:, 1:k); % k为希望保留的主成分数量
```
在以上章节中,我们探讨了数据预处理的各个方面,为后续的聚类分析打下了坚实的基础。只有数据准备得当,才能使聚类分析的结果更具有意义和价值。接下来的章节将详细介绍聚类算法的实施。
# 3. 基本聚类算法实施
## 3.1 K-均值聚类算法
### 3.1.1 K-均值算法原理
K-均值聚类是数据科学中一种非常流行的非监督学习算法。其基本原理是将数据点分配到K个集群中,其中每个数据点属于离它最近的均值(即簇心)所代表的集群。算法迭代进行,不断优化集群内的点与该集群中心之间的距离,以达到划分的目的。具体步骤包括随机选择K个数据点作为初始的簇心,然后将其他点根据最小距离分配给最近的簇心,形成K个簇。之后重新计算每个簇的中心,并重复上述过程,直到簇中心不再发生变化或者达到预设的迭代次数。
### 3.1.2 MATLAB实现K-均值聚类
在MATLAB中实现K-均值聚类算法,需要利用到内置的`kmeans`函数。这个函数可以直接处理数据的聚类问题,并返回每个数据点所属的簇和簇中心。下面提供一个简单的示例代码:
```matlab
% 假设有一组二维数据 points
points = [randn(100,2)*0.75+ones(100,2);
randn(100,2)*0.5-ones(100,2)];
% 定义簇的数量 K
K = 2;
% 使用 kmeans 函数进行聚类
[idx, centroids] = kmeans(points, K);
% idx 是一个包含每个点所属簇索引的向量
% centroids 是每个簇中心点的坐标
% 可视化结果
figure;
gscatter(points(:,1), points(:,2), idx);
hold on;
plot(centroids(:,1), centroids(:,2), 'kx', 'MarkerSize', 10, 'LineWidth', 3);
legend('Cluster 1', 'Cluster 2', 'Centroids');
title('K-means Clustering');
hold off;
```
上述代码将随机生成一组二维数据,并利用`kmeans`函数进行聚类。`kmeans`函数的返回值`idx`包含了数据点所属的簇索引,而`centroids`则是每个簇的中心坐标。最后使用`gscatter`函数将聚类结果可视化。代码中省略了参数调整和迭代次数限制,但实际使用中可以对这些参数进行调整以获得更好的聚类效果。
## 3.2 层次聚类算法
### 3.2.1 层次聚类的概念
层次聚类是一种通过建立层次的簇来组织数据的聚类方法。该方法并不需要预先指定簇的数量,而是逐步构建出一个聚类树,树的每个节点代表一个簇。它有两种主要的实现方式:凝聚法(自底向上,先将各个点作为单独的簇,然后逐渐合并)和分裂法(自顶向下,开始时将所有点视为一个簇,然后逐步分裂)。层次聚类对于理解数据的层次结构非常有用,特别适用于需要详细探索数据结构的场景。
### 3.2.2 MATLAB层次聚类的步骤
在MATLAB中进行层次聚类分析,我们通常使用`linkage`和`dendrogram`函数。`linkage`函数用于计算数据点之间的距离,而`dendrogram`函数则用于绘制聚类树状图。下面给出一个使用层次聚类算法的MATLAB代码示例:
```matlab
% 使用相同的数据集 points
% 计算层次聚类的链接
Z = linkage(points, 'ward');
% 绘制聚类树状图
figure;
dendrogram(Z);
title('Hierarchical Clustering Dendrogram');
xlabel('Data points');
ylabel('Distance');
% 通过剪切树状图来确定簇的数量,选择一个距离阈值
threshold = 4;
[keep, order] = dendrogram(Z, threshold);
idx
```

 百万级
高质量VIP文章无限畅学
百万级
高质量VIP文章无限畅学
 千万级
优质资源任意下载
千万级
优质资源任意下载
 C知道
免费提问 ( 生成式Al产品 )
C知道
免费提问 ( 生成式Al产品 )
0
0
相关推荐

专栏简介
本专栏提供全面的 MATLAB 多变量分析指南,涵盖从基础概念到高级应用的所有方面。专栏文章包括:
* 多变量分析入门:了解基本原理和实例应用
* 实战指南:从基础到案例研究的深入讲解
* 进阶技巧:提升算法性能和优化策略
* 变量选择:掌握艺术与科学实践
* 数据挖掘应用:探索 MATLAB 多变量分析的强大功能
* 大数据处理:应对高维数据集的实用技巧
* 异常值处理:检测和管理策略
* 模型验证和评估:确保模型的可靠性和准确性
* 行业应用:从理论到实际应用的完整旅程
* 协变量分析:深入理解理论和应用
* 主成分分析:深入解析原理和应用
* 偏最小二乘回归:理论和实践的融合
* 多元线性回归:掌握多变量分析的核心
* 判别分析:分类问题的应用和案例研究
* 聚类分析:掌握步骤和提升分析技巧
* 时间序列数据处理:多变量分析的应用秘籍
* 因子分析:从基础到高级应用的完整路径
专栏目录
最低0.47元/天 解锁专栏
买1年送3月
百万级
高质量VIP文章无限畅学
千万级
优质资源任意下载
C知道
免费提问 ( 生成式Al产品 )
最新推荐
【DEH调节逻辑图解】:掌握基础知识,精通应用

# 摘要
本文系统地介绍了DEH(Digital Electro-Hydraulic)调节系统的理论基础与实践应用。首先解释了DEH系统的工作原理,阐述了其组成和基本流程。接着,文章深入分析了DEH调节中的关键参数,包括压力、温度设定点,流量控制和功率调节,以及PID(比例、积分、微分)控制的解析。此外,本文还探讨了DEH调节系统与其他系统的协同
【AT32F435手册深度解读】:揭秘隐藏性能参数与应用技巧
# 摘要
本文全面介绍了AT32F435微控制器,从其概述开始,深入分析了硬件架构和内存存储配置,探讨了高性能的ARM Cortex-M4内核特性及其性能参数。详细讨论了编程与开发环境,强调了IDE配置、调试技巧以及编程接口的优化。文章进一步探索了AT32F435的高级功能,包括电源管理、安全特性、实时时钟等,并分析了在工业自动化控制、消费电子产品和无线通信应用中的
【sCMOS相机驱动电路全攻略】:20年经验大师带你破解设计与故障处理的神秘面纱
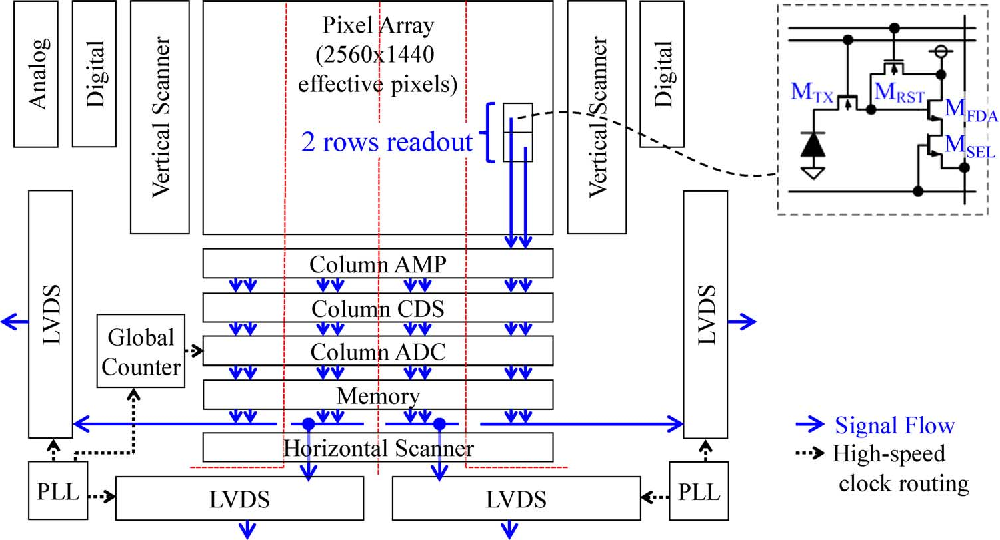
# 摘要
本论文全面介绍了sCMOS相机驱动电路的设计原理、实践与高级应用,并对故障处理技巧和未来发展趋势进行了深入探讨。首先概述了sCMOS相机驱动电路的基本概念及其重要性,接着从理论基础入手,详尽分析了sCMOS相机的工作原理、关键参数和信号完整性。在设计实践章节中,讨论了电路设计前期准备、布局布线以及调试测试的
【自动售货机界面设计】:交互逻辑实现的秘诀

# 摘要
自动售货机界面设计是提升用户体验、增强交互效率及实现技术革新的关键要素。本文详细探讨了自动售货机界面设计的理论基础,如用户体验的重要性、界面设计的交互原则及布局视觉层次。接着,文章深入分析了界面交互逻辑,包括导航、交易流程和错误处理的设计。在实践层面,本文阐述了用户研究、原型设计、用户测试以及迭代优化的过程。技术实现部分则讨论了界面开发工具、功能模块编码和测试方法。最后
【CAD2002块操作全攻略】
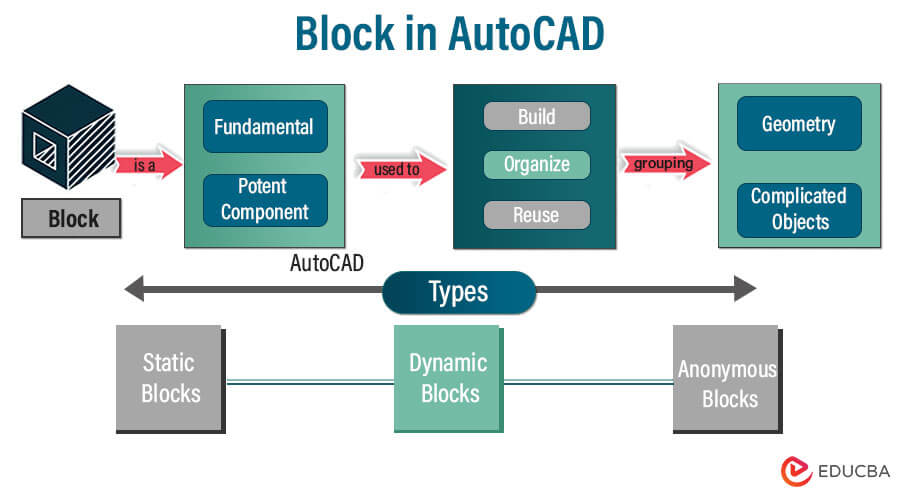
# 摘要
CAD块操作是提高CAD绘图效率和标准化的关键技术。本文旨在介绍CAD块操作的基本知识,包括块的创建、编辑、命名及属性管理。进一步探讨高级技巧,如动态块的创建和使用,以及块与外部数据库的交互。文章还涵盖了块操作在实际应用中的案例分析,例如工程图纸中的块应用,协作设计中块操作的应用,以及自动化工具的开发。最后,本文针对块操作中可能遇到的常见问题,提出相应的诊断方法和性能优化策略,并通过案例
【MATLAB内存布局精通】:数组方向性对性能影响的深入剖析
# 摘要
本文综合探讨了MATLAB中数组方向性对性能的影响,并提出了相应的性能优化策略。首先,从理论层面分析了数组方向性的重要性以及其如何影响缓存效率,并构建了相应的数学模型。其次,本文深入到MATLAB的实践操作,探讨了方向性在性能优化中的具体应用,并通过案例研究展示了方向性优化的实际效果。文章还详细阐述了优化算法的设计原则,研究了MATLAB内置函数及自定义函
C语言回调函数:使用技巧与实现细节详解
# 摘要
回调函数是软件开发中广泛应用的一种编程技术,它允许在程序执行的某个点调用一个预先定义的函数,从而实现模块化和事件驱动的程序设计。本文详细探讨了回调函数的基本概念和在C语言中使用函数指针实现回调的技巧。通过分析典型的使用场景,如事件处理和算法设计模式,本文提供了如何在C语言中高效且安全地使用回调函数的深入指导。此外,文中还介绍了性能优化和安全注意事项,包括减少开销、防止内存泄漏、回调注入攻
【监控大师】:掌握西门子SINUMERIK测量循环,实现生产过程全面监控
# 摘要
本文全面探讨了SINUMERIK测量循环的理论基础、实践应用以及监控大师系统在其中所扮演的角色。首先介绍了测量循环的基本概念、分类、特点和参数设置,其次解析了监控大师系统的架构和功能模块,并说明了如何利用该系统实现对生产过程的全面监控。文章重点通过实际案例分析,展示了测量循环在生产中的应用,并探讨了监控大师在实时监控和故障预测中的作用,以及如何通过这些技术提升生产效率和质量。最后,文章讨论了系统优化的策略,面临的挑战和未来发展趋势,并分享了成功的案例研究与经验。
# 关键字
SINUMERIK测量循环;系统架构;实时监控;生产效率;故障预测;案例研究
参考资源链接:[西门子SIN
Word 2016 Endnotes加载项:提升工作流的十个技巧
# 摘要
本文系统地介绍了Word 2016中Endnotes加载项的使用方法和技巧,阐述了Endnotes的基本概念、作用以及其在提升文档质量和优化工作流中的重要性。文章详细描述了Endnotes加载项的安装、配置和个性化设置,同时提供了管理尾注的策略和与文献管理软件整合的方法。此外,文章还探讨了在Word中快速插入和编辑Endnotes的技巧,分享了提高文档一致性和工作效率的高
资源上传下载、课程学习等过程中有任何疑问或建议,欢迎提出宝贵意见哦~我们会及时处理!
点击此处反馈


专栏目录
最低0.47元/天 解锁专栏
买1年送3月
百万级
高质量VIP文章无限畅学
千万级
优质资源任意下载
C知道
免费提问 ( 生成式Al产品 )