深度度量学习实战案例:从理论到现实,助你深入理解相似度计算应用
发布时间: 2024-08-23 03:20:41 阅读量: 42 订阅数: 48 

java计算器源码.zip
# 1. 深度度量学习简介
深度度量学习是一种机器学习技术,用于学习度量函数,该函数可以计算两个数据点之间的相似性或距离。与传统度量学习方法不同,深度度量学习使用深度神经网络来学习度量函数,从而能够从高维数据中提取复杂的特征表示。这种方法在解决各种计算机视觉和自然语言处理任务中表现出优异的性能。
深度度量学习的优点在于它能够学习到数据中固有的相似性和差异性,而无需显式地定义特征或距离度量。这使得它成为解决复杂任务的强大工具,例如人脸识别、图像检索和自然语言处理。
# 2. 深度度量学习算法
深度度量学习算法旨在学习一个度量函数,该函数能够将具有相似语义含义的数据点映射到特征空间中的相近位置,而将具有不同语义含义的数据点映射到特征空间中的较远位置。
### 2.1 浅层度量学习算法
浅层度量学习算法利用手工设计的度量函数来计算数据点之间的相似度。这些算法简单易用,但表示能力有限。
#### 2.1.1 欧氏距离
欧氏距离是一种常用的浅层度量学习算法,它计算两个数据点之间各个维度上的差值的平方和的平方根。欧氏距离定义如下:
```python
def euclidean_distance(x1, x2):
"""计算两个数据点之间的欧氏距离。
参数:
x1 (list): 第一个数据点。
x2 (list): 第二个数据点。
返回:
float: 欧氏距离。
"""
distance = 0.0
for i in range(len(x1)):
distance += (x1[i] - x2[i]) ** 2
return distance ** 0.5
```
#### 2.1.2 余弦相似度
余弦相似度是一种衡量两个向量之间方向相似性的度量函数。它计算两个向量的点积与它们各自模长的乘积的比值。余弦相似度定义如下:
```python
def cosine_similarity(x1, x2):
"""计算两个数据点之间的余弦相似度。
参数:
x1 (list): 第一个数据点。
x2 (list): 第二个数据点。
返回:
float: 余弦相似度。
"""
dot_product = 0.0
norm1 = 0.0
norm2 = 0.0
for i in range(len(x1)):
dot_product += x1[i] * x2[i]
norm1 += x1[i] ** 2
norm2 += x2[i] ** 2
return dot_product / (norm1 ** 0.5 * norm2 ** 0.5)
```
### 2.2 深层度量学习算法
深层度量学习算法利用深度神经网络来学习度量函数。这些算法表示能力更强,能够捕捉数据中的复杂关系。
#### 2.2.1 Siamese网络
Siamese网络是一种深层度量学习算法,它使用两个共享权重的子网络来提取数据点的特征。然后,它计算两个特征向量之间的欧氏距离或余弦相似度。Siamese网络结构如下:
```
Input 1 Input 2
| |
v v
Embedding Network 1 Embedding Network 2
| |
v v
Feature Vector 1 Feature Vector 2
| |
v v
Distance Metric (e.g., Euclidean Distance)
|
v
Similarity Score
```
#### 2.2.2 Triplet网络
Triplet网络是一种深层度量学习算法,它使用三个数据点(锚点、正样本和负样本)来学习度量函数。它通过最小化锚点和正样本之间的距离,同时最大化锚点和负样本之间的距离来训练网络。Triplet网络结构如下:
```
Anchor Positive Negative
| | |
v v v
Embedding Network 1 Emb
```

 百万级
高质量VIP文章无限畅学
百万级
高质量VIP文章无限畅学
 千万级
优质资源任意下载
千万级
优质资源任意下载
 C知道
免费提问 ( 生成式Al产品 )
C知道
免费提问 ( 生成式Al产品 )
0
0
相关推荐

专栏简介
深度度量学习方法专栏深入探讨了深度度量学习的原理、应用和实战指南。它涵盖了从基础原理到前沿技术的算法全解析,以及在图像检索、人脸识别、自然语言处理、计算机视觉、推荐系统、医疗影像等领域的创新应用。通过揭秘相似度计算秘诀,该专栏旨在帮助读者轻松掌握相似度计算技术,提升相似度计算能力,并将其应用于实际场景中。专栏还提供了高质量数据集构建秘籍、模型训练技巧、模型评估指南和模型部署策略,为读者提供从数据准备到模型部署的全方位指导。
专栏目录
最低0.47元/天 解锁专栏
买1年送3月
百万级
高质量VIP文章无限畅学
千万级
优质资源任意下载
C知道
免费提问 ( 生成式Al产品 )
最新推荐
Qt5.9.1项目打包详解:打造高效、安全的软件安装包(专家级教程)
# 摘要
本文详细介绍了基于Qt5.9.1的项目打包过程,涵盖了项目构建、配置、跨平台打包技巧、性能优化、安全性加固以及自动化打包与持续集成等多个方面。在项目构建与配置部分,文章强调了开发环境一致性的重要性、依赖库的管理以及不同平台下qmake配置项的分析。跨平台打包流程章节详细阐述了针对Windows、Linux和macOS
【工作效率提升秘籍】:安川伺服驱动器性能优化的必学策略
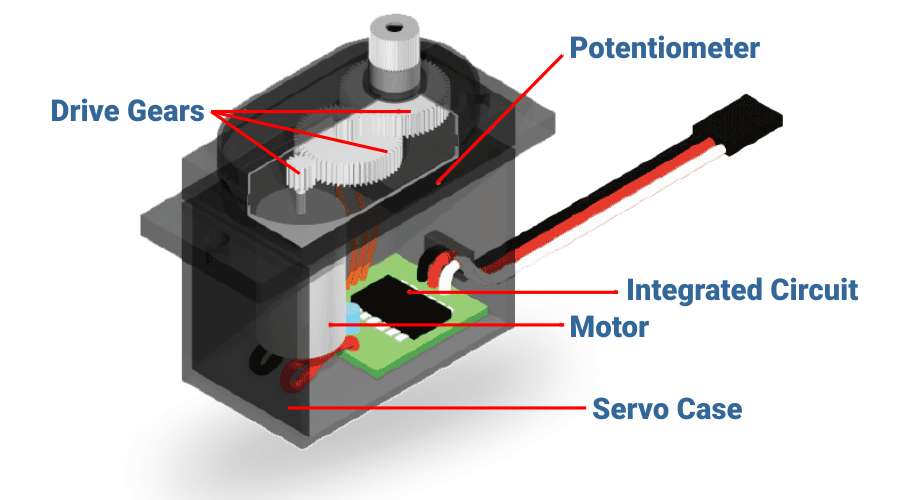
# 摘要
伺服驱动器作为自动化控制系统的核心部件,在提高机械运动精度、速度和响应时间方面发挥着关键作用。本文首先介绍了伺服驱动器的基本原理及其在不同领域的应用情况。接着,文章深入探讨了安川伺服驱动器的硬件组成、工作原理和性能理论指标,并针对性能优化的理论基础进行了详细阐述。文中提供了多种性能优化的实践技巧,包括参数调整、硬件升级、软件优化,并通过具体的应用场景分析,展示了这些优化技巧的实际效果。此外,本文还预测了安川伺服驱动器未来
USB Gadget驱动的电源管理策略:节能优化的黄金法则

# 摘要
本文全面介绍了USB Gadget驱动的电源管理机制,涵盖了USB电源管理的基础理论、设计原则以及实践应用。通过探讨USB电源类规范、电源管理标准与USB Gadget的关系,阐述了节能目标与性能平衡的策略以及系统级电源管理策略的重要性。文章还介绍了USB Gadget驱动的事件处理、动态电源调整技术、设备连接与断开的电源策略,并探索了低功耗模式的应用、负载与电流
【实时调度新境界】:Sigma在实时系统中的创新与应用

# 摘要
实时系统对于调度算法的性能和效率有着严苛的要求,Sigma算法作为一类实时调度策略,在理论和实践中展现出了其独特的优势。本文首先介绍了实时系统的基础理论和Sigma算法的理论框架,
【嵌入式Linux文件系统选择与优化】:提升MP3播放器存储效率的革命性方法

# 摘要
本文详细探讨了嵌入式Linux文件系统的选择标准、优化技术、以及针对MP3播放器的定制化实施。首先介绍了文件系统的基础概念及其在嵌入式系统中的应用,然后对比分析了JFFS2、YAFFS、UBIFS、EXT4和F2FS等常见嵌入式Linux文件系统的优缺点,
【安全防护】:防御DDoS攻击的有效方法,让你的网络坚不可摧

# 摘要
分布式拒绝服务(DDoS)攻击是一种常见的网络威胁,能够通过大量伪造的请求使目标服务不可用。本文首先介绍了DDoS攻击的基本原理和危害,并探讨了DDoS攻击的不同分类和工作机制。随后,文章深入分析了防御DDoS攻击的理论基础,包括防御策略的基本原
无线局域网安全升级指南:ECC算法参数调优实战

# 摘要
随着无线局域网(WLAN)的普及,网络安全成为了研究的热点。本文综述了无线局域网的安全现状与挑战,着重分析了椭圆曲线密码学(ECC)算法的基础知识及其在WLAN安全中的应用。文中探讨了ECC算法相比其他公钥算法的优势,以及其在身份验证和WPA3协议中的关键作用,同时对ECC算法当前面临的威胁和参数选择对安全性能的影响进行了深入分析。此外,文章还介绍了ECC参数调优的实战技巧,包括选择标准和优化工具,并提供案例分析。最后,
【百度输入法皮肤安全问题探讨】:保护用户数据与设计版权的秘诀

# 摘要
百度输入法皮肤作为个性化定制服务,其安全性和版权保护问题日益受到重视。本文首先概述了百度输入法皮肤安全问题的现状,接着从理论基础和实践方法两个方面详细探讨了皮肤数据安全和设计版权保护的有效策略。文中分析了隐私保护的技术手段和版权法律知识应用,以及恶意代码检测与防御的
高级噪声分析:提升IC模拟版图设计的精准度

# 摘要
高级噪声分析在集成电路(IC)版图设计中扮演着关键角色,影响着电路的性能和器件的寿命。本文首先概述了噪声分析的种类及其特性,并探讨了噪声对版图设计提出的挑战,如信号和电源完整性问题。接着,本文深入探讨了噪声分析的理论基础,包括噪声分析模型和数学方法,并分析了噪声分析工具与软件的实际应用。通过实验设计与案例研究,文章提出了版图设计中
资源上传下载、课程学习等过程中有任何疑问或建议,欢迎提出宝贵意见哦~我们会及时处理!
点击此处反馈


专栏目录
最低0.47元/天 解锁专栏
买1年送3月
百万级
高质量VIP文章无限畅学
千万级
优质资源任意下载
C知道
免费提问 ( 生成式Al产品 )