医疗影像新突破:深度度量学习算法助力疾病诊断,提升医疗效率
发布时间: 2024-08-23 03:09:09 阅读量: 31 订阅数: 21 
# 1. 医疗影像新突破:深度度量学习算法简介
深度度量学习算法是机器学习领域中一种新兴技术,它旨在学习衡量数据点之间相似性和差异性的度量函数。在医疗影像领域,深度度量学习算法已成为一项突破性的技术,为医疗影像分析、诊断和治疗带来了新的可能性。
深度度量学习算法利用深度神经网络的强大功能,从医疗影像中提取高度抽象且具有区分性的特征。这些特征可以有效地衡量影像之间的相似性和差异性,从而实现准确的影像分类、分割和诊断。
# 2. 深度度量学习算法理论基础
### 2.1 度量学习的基本概念
#### 2.1.1 度量空间和相似性度量
**度量空间**是一个集合,其中每个元素之间都定义了一个度量,该度量表示元素之间的相似性或距离。度量通常是一个非负实数,较小的度量表示元素更相似或更接近,而较大的度量表示元素更不相似或更远。
**相似性度量**是度量空间中元素之间相似性的度量。它通常是一个归一化的值,范围从 0 到 1,其中 0 表示元素完全不相似,而 1 表示元素完全相似。
#### 2.1.2 度量学习的目标和优化方法
**度量学习的目标**是学习一个度量,该度量可以有效区分不同类别的元素,同时使同类别的元素更接近。
**度量学习的优化方法**通常涉及使用监督学习算法,该算法根据标记的数据来学习度量。最常用的优化方法包括:
* **对比损失函数:**该函数最大化同类元素之间的相似性,同时最小化不同类元素之间的相似性。
* **三元组损失函数:**该函数通过比较一个锚点元素与其正样本和负样本之间的相似性来学习度量。
* **四元组损失函数:**该函数通过比较两个锚点元素及其各自的正样本和负样本之间的相似性来学习度量。
### 2.2 深度度量学习的网络结构
#### 2.2.1 卷积神经网络简介
**卷积神经网络(CNN)**是一种深度学习模型,专门用于处理网格状数据,例如图像和视频。CNN 由一系列卷积层组成,每个卷积层使用卷积核在输入数据上滑动,提取特征。
#### 2.2.2 度量学习网络的常见架构
**孪生网络:**孪生网络使用两个相同的 CNN 来提取输入元素的特征,然后使用度量函数计算特征之间的相似性。
**三元组网络:**三元组网络使用三个 CNN 来提取锚点元素、正样本和负样本的特征,然后使用三元组损失函数学习度量。
**四元组网络:**四元组网络使用四个 CNN 来提取两个锚点元素及其各自的正样本和负样本的特征,然后使用四元组损失函数学习度量。
**示例代码:**
```python
import tensorflow as tf
# 孪生网络示例
anchor_input = tf.keras.Input(shape=(224, 224, 3))
positive_input = tf.keras.Input(shape=(224, 224, 3))
# 使用相同的 CNN 提取特征
anchor_features = tf.keras.layers.Conv2D(32, (3, 3), activation='relu')(anchor_input)
positive_features = tf.keras.layers.Conv2D(32, (3, 3), activation='relu')(positive_input)
# 计算相似性
similarity = tf.keras.layers.Dot(axes=1)([anchor_features, positive_features])
# 编译模型
model = tf.keras.Model(inputs=[anchor_input, positive_input], outputs=similarity)
```
**代码逻辑分析:**
* `anchor_i

 百万级
高质量VIP文章无限畅学
百万级
高质量VIP文章无限畅学
 千万级
优质资源任意下载
千万级
优质资源任意下载
 C知道
免费提问 ( 生成式Al产品 )
C知道
免费提问 ( 生成式Al产品 )
0
0
相关推荐

专栏简介
深度度量学习方法专栏深入探讨了深度度量学习的原理、应用和实战指南。它涵盖了从基础原理到前沿技术的算法全解析,以及在图像检索、人脸识别、自然语言处理、计算机视觉、推荐系统、医疗影像等领域的创新应用。通过揭秘相似度计算秘诀,该专栏旨在帮助读者轻松掌握相似度计算技术,提升相似度计算能力,并将其应用于实际场景中。专栏还提供了高质量数据集构建秘籍、模型训练技巧、模型评估指南和模型部署策略,为读者提供从数据准备到模型部署的全方位指导。
专栏目录
最低0.47元/天 解锁专栏
买1年送3月
百万级
高质量VIP文章无限畅学
千万级
优质资源任意下载
C知道
免费提问 ( 生成式Al产品 )
最新推荐
【CATIA V5复合材料设计终极指南】:从入门到专业设计的全攻略
# 摘要
CATIA V5作为一种先进的三维设计软件,在复合材料设计领域中扮演着重要角色。本文详细介绍了CATIA V5在复合材料设计中的应用,从基础知识、设计工具与环境、建模与分析到仿真与测试等方面进行了全面的探讨。通过对复合材料的分类、特性分析以及设计流程优化技巧的阐述,本文旨在提供给读者一个关于如何有效利用CATIA V5进行复合材料设计的实践指南。本文还通过案例研究,展示了复合材料在不同行业,如航空航天和汽车制造中的实际应用,并讨论了仿真技术在产品开发中的重要作用。关键字
# 关键字
复合材料设计;CATIA V5;机械性能分析;设计流程优化;结构分析与优化;仿真模拟
参考资源链接:
技术债务不再是问题:中控BS架构考勤系统的代码健康维护策略

# 摘要
本文全面探讨了中控BS架构考勤系统的设计、维护策略和性能优化。文章首先概述了中控BS架构的定义、优势以及技术债务的形成与影响,强调了代码健康维护的重要性。随后,深入讨论了代码健康维护的理论框架,包括策略设计原则、设计模式与重构方法,以及自动化测试和持续集成的实施。接着,通过实际案例分析,探讨了代码重构实践、测试驱动开发(TDD)的实施和持续部署(CD)与代码质量保证的策
程序员认证考点:字符串处理函数的编写技巧
# 摘要
字符串处理作为编程中不可或缺的技能,对软件开发的各个方面都有深远影响。本文从字符串处理的基本理论讲起,详细介绍了字符串创建与销毁、查找与替换、分割与连接等基础操作,强调了正确内存管理的重要性。进一步,本文探讨了使用正则表达式、处理Unicode及多字节字符集,以及字符串的国际化和本地化等高级技术。性能优化部分着重于算法选择、内存管理和编译器优化,以提高字符串处理的效率
光传输安全新防线:保护ODU flex-G.7044免受网络攻击
# 摘要
随着光传输技术的不断发展,网络安全问题日益突出,ODU flex-G.7044作为一种先进的传输技术,其安全性和可靠性成为关注焦点。本文首先介绍了光传输与网络安全的基础知识,然后深入探讨ODU flex-G.7044技术的工作原理及其技术优势和应用场景。第三章分析了针对ODU flex-G.7044的网络攻击手段及其带来的风险,接着在第四章提出
JY01A直流无刷IC全攻略:深入理解与高效应用
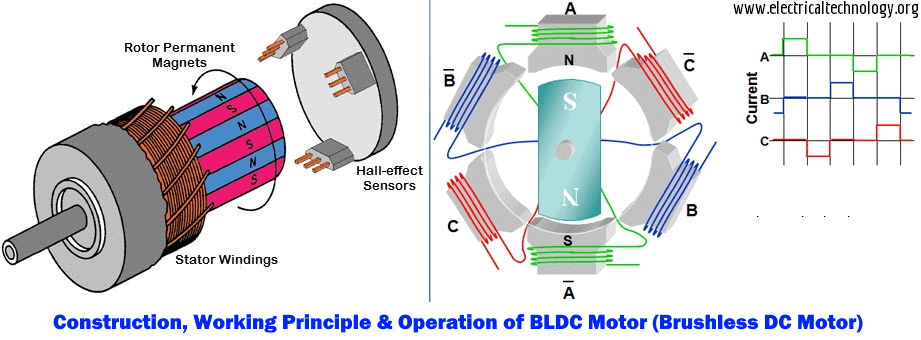
# 摘要
本文详细介绍了JY01A直流无刷IC的设计、功能和应用。文章首先概述了直流无刷电机的工作原理及其关键参数,随后探讨了JY01A IC的功能特点以及与电机集成的应用。在实践操作方面,本文讲解了JY01A IC的硬件连接、编程控制,并通过具体
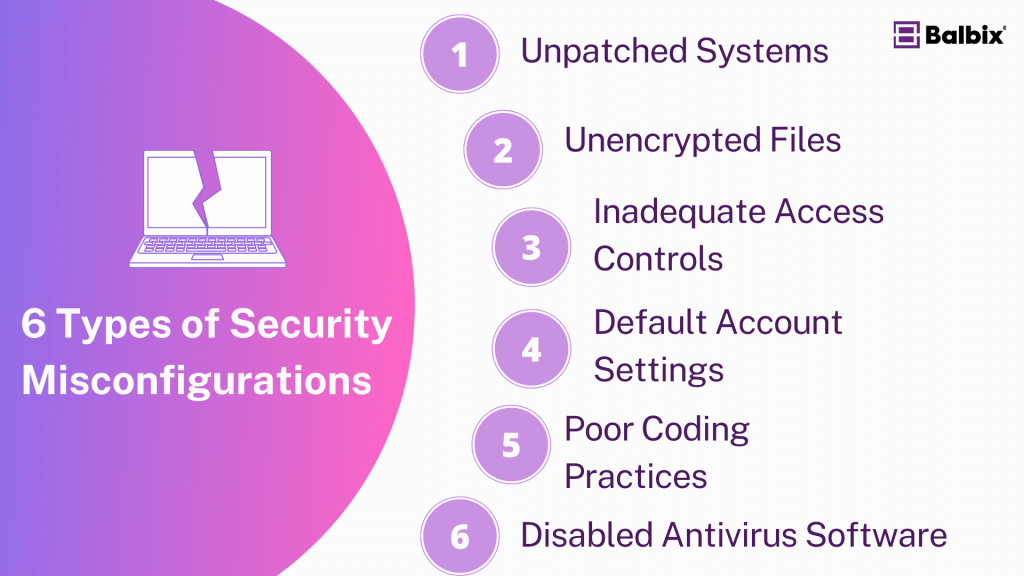
无线定位算法安全防护指南:防范定位数据泄露的有效措施
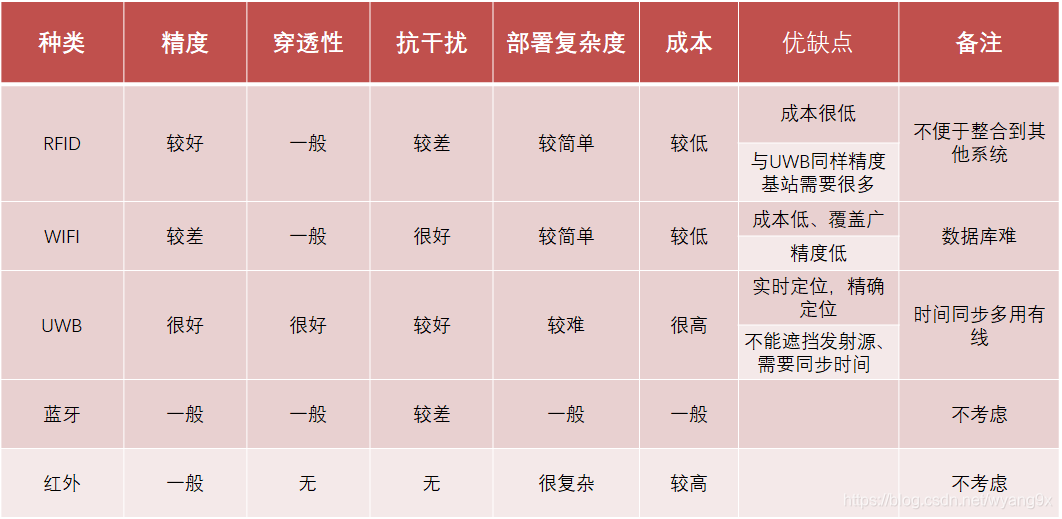
# 摘要
无线定位技术在提供便捷服务的同时,也带来了严重的安全风险,尤其是定位数据的泄露问题。本文首先概述了无线定位技术及其潜在的安全风险,然后深入分析了定位数据泄露的途径与影响,包括信号截获、网络攻击
【跨领域视角】:探索S参数转换表在各行各业的应用
# 摘要
S参数转换表是现代电信、计算机科学及制造业中不可或缺的技术工具。本文首先介绍了S参数转换表的基础概念及其在射频系统中的作用,并详述了它在信号完整性分析、材料测试、机械设计和质量控制中的广泛应用。然后,探讨了S参数转换表在计算机科学领域中的应用,包括高速网络通信、计算机硬件设计和软件开发。最后,本文展望了S参数转换表在新
【TongWeb7事务管理与数据一致性】:业务数据安全的保障
# 摘要
TongWeb7事务管理是确保企业级应用数据一致性和完整性的关键组成部分。本文首先介绍了事务管理的基础理论,包括事务的ACID属性、数据一致性的理论支持和隔离级别的分类。接着,探讨了TongWeb7在事务管理实践方面的高级特性和性能优化策略,如嵌套和分布式事务、事务日志及恢复机制。文章还深入分析了数据一致性在TongWeb7中的实现细节,包括锁机制、死锁预防和事务日志的管理。最后,针对业务数据安全进阶话题,本文讨论
【优化案例研究】:从问题到解决方案,PID控制系统的升级之旅
# 摘要
本文对PID控制系统进行了全面概述,深入解析了PID控制理论,包括控制器原理、数学模型构建以及参数意义。文章还探讨了PID控制器参数调节的经典方法、优化技术及自动调整策略。针对控制系统中常见的超调、稳定性问题以及噪声干扰,本文提供了理论分析和改进方法。对于非线性和复
【老旧系统升级】:如何为传统Delphi系统添加现代进度反馈
# 摘要
随着信息技术的快速发展,老旧系统的升级已成为维持企业竞争力的关键步骤。本文探讨了老旧Delphi系统升级的需求与挑战,回顾了Delphi的基础知识,强调了现代进度反馈机制的重要性,并提供了现代化改造的实践案例。文章详细讨论了老旧Delphi系统功能重构、进度反馈机制的集成,以及系统测试与优化的方法。最后
资源上传下载、课程学习等过程中有任何疑问或建议,欢迎提出宝贵意见哦~我们会及时处理!
点击此处反馈


专栏目录
最低0.47元/天 解锁专栏
买1年送3月
百万级
高质量VIP文章无限畅学
千万级
优质资源任意下载
C知道
免费提问 ( 生成式Al产品 )