深度学习透明度提升:神经网络可解释性实战演练
发布时间: 2024-09-06 03:58:34 阅读量: 109 订阅数: 48 
# 1. 神经网络可解释性的理论基础
神经网络可解释性是人工智能领域的一项重要议题,它涉及到模型输出的逻辑性和透明度。可解释性不仅能增强用户对AI系统的信任,还能助力开发者发现模型潜在的错误和偏见,进而优化模型结构和算法。
随着深度学习的发展,神经网络的结构和复杂性日益增长,模型的决策过程如同“黑箱”,越来越难以理解。为此,学界和产业界都开始重视神经网络可解释性(Neural Network Interpretability),试图打开这个“黑箱”,提升人工智能系统的透明度和可靠性。
可解释性可以通过不同的理论框架来实现,例如,通过信息论、统计学和认知科学的理论来解释模型的决策依据,或通过因果关系的推导来揭示模型预测的深层次原因。本章将探讨神经网络可解释性的理论基础,为后续章节中介绍的技术方法和实践案例打下坚实的理论支撑。
# 2. 神经网络可解释性的技术方法
## 2.1 模型内部可视化的原理与工具
模型内部可视化是将神经网络的内部机制,包括权重、激活函数的输出以及层间的交互等,以直观的形式展现给研究者或开发者,以帮助理解模型的决策过程。此方法能揭示模型的工作原理,对识别模型的潜在问题和提升模型性能具有重要作用。
### 2.1.1 权重可视化
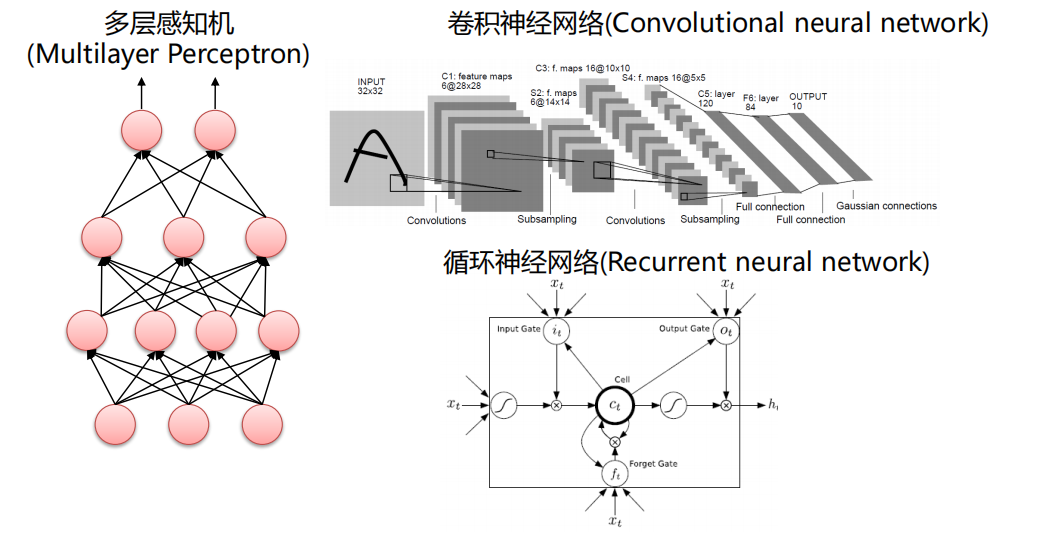
权重可视化是展示模型内部权重的最直观方式,它有助于理解输入特征与输出决策之间的关系。对于卷积神经网络(CNN),权重可视化尤为重要,因为权重图可以揭示网络对特定模式的敏感性。
**权重可视化代码示例:**
```python
import tensorflow as tf
import matplotlib.pyplot as plt
# 加载预训练模型
model = tf.keras.applications.VGG16(weights='imagenet', include_top=False)
layer_outputs = [layer.output for layer in model.layers if 'conv' in layer.name]
# 创建一个模型,输出特定卷积层的输出
activation_model = tf.keras.models.Model(inputs=model.input, outputs=layer_outputs)
activations = activation_model.predict(input_image)
# 选择一个卷积层查看权重
first_layer_activation = activations[0]
# 绘制权重
plt.matshow(first_layer_activation[0, :, :, 0], cmap='viridis')
plt.show()
```
**参数说明与逻辑分析:**
在上述代码中,我们首先加载了一个VGG16模型,并选取了所有卷积层的输出。然后,我们创建了一个新的模型,仅输出卷积层的激活。对于特定输入图像`input_image`,我们获取了这些层的激活,并选择了其中一个卷积层的激活来可视化。`plt.matshow`函数用于绘制权重矩阵。
### 2.1.2 激活映射与特征可视化
激活映射关注的是网络中特定层的激活状态,这有助于研究者理解网络在处理输入数据时如何提取和使用特征。
**特征可视化代码示例:**
```python
from keras.models import Model
import numpy as np
# 加载模型并选择要可视化的卷积层
layer_outputs = [layer.output for layer in model.layers if 'conv' in layer.name]
activation_model = Model(inputs=model.input, outputs=layer_outputs)
# 获取特定层的激活
activations = activation_model.predict(input_image)
# 选择一个卷积层的激活用于可视化
first_layer_activation = activations[0]
# 将激活转换成图像
fig, axarr = plt.subplots(nrows=1, ncols=1, figsize=(20, 20))
axarr.matshow(first_layer_activation[0, :, :, 0], cmap='viridis')
plt.show()
```
**参数说明与逻辑分析:**
这个代码片段与权重可视化的例子非常相似,但是这次我们关注的是激活而不是权重。激活是从模型的卷积层提取出来的,可以显示哪些特征被激活,帮助解释模型在做什么。
## 2.2 基于特征重要性的解释方法
基于特征重要性的解释方法试图量化每个输入特征对最终决策的贡献。这些方法通过计算特征对输出的局部或全局影响,帮助用户理解模型的工作原理。
### 2.2.1 梯度下降法及其改进
梯度下降法是通过计算损失函数相对于特征的梯度来评估特征重要性的一种方法。其核心思想是,如果特征x对损失函数L有较大影响,那么L对x的梯度应该相对较大。
**梯度下降法代码示例:**
```python
from keras import backend as K
def grad_cam(input_model, image_array, layer_name):
preds = input_model.predict(image_array)
loss = K.mean(preds[:, class_idx])
grads = K.gradients(loss, input_model.get_layer(layer_name).output)[0]
pooled_grads = K.mean(grads, axis=(0, 1, 2))
iterate = K.function([input_model.input], [pooled_grads, input_model.get_layer(layer_name).output[0]])
pooled_grads_value, conv_layer_output_value = iterate([image_array])
for i in range(pooled_grads_value.shape[-1]):
conv_layer_output_value[:, :, i] *= pooled_grads_value[i]
heatmap = np.mean(conv_layer_output_value, axis=-1)
heatmap = np.maximum(heatmap, 0)
heatmap /= np.max(heatmap)
return heatmap
# 生成热力图
heatmap = grad_cam(model, input_image, layer_name='block5_conv3')
```
**参数说明与逻辑分析:**
这段代码实现了一个称为Grad-CAM的方法,它是一个用于CNN解释的流行工具。我们首先对模型进行预测,并计算损失函数相对于目标层输出的梯度。梯度被平均后乘以目标层的激活输出以产生热力图。热力图高亮显示了对模型预测有较大贡献的区域。
### 2.2.2 SHAP和LIME的对比分析
SHAP(SHapley Additive exPlanations)和LIME(Local Interpretable Model-agnostic Explanations)是目前流行的两种特征重要性解释方法。它们通过模拟局部模型的行为来解释预测。
**SHAP代码示例:**
```python
import shap
# 创建一个shap explainer对象
explainer = shap.DeepExplainer(model, background_dataset)
shap_values = explainer.shap_values(input_image)
# 可视化特定预测的shap值
shap.image_plot(shap_values, -input_image)
```
**参数说明与逻辑分析:**
SHAP explainer对训练集中的背景数据进行了模型模拟。使用训练好的explainer对象,我们可以计算输入图像的shap值。这些值可以可视化为图像,显示每个特征对模型预测的贡献。SHAP利用博弈论中的Shapley值,为每个特征分配公平的贡献值。
**LIME代码示例:**
```python
import lime
from lime import lime_image
# 创建一个LIME解释器
explainer = lime_image.LimeImageExplainer()
explanation = explainer.explain_instance(input_image[0], model.predict_function, top_labels=5, hide_color=0, num_samples=1000)
# 可视化LIME解释
explanation.show_in_notebook()
```
**参数说明与逻辑分析:**
LIME解释器通过在图像的局部区域进行扰动来生成许多“邻近样本”。这些邻近样本随后被用来训练一个简单的模型,以模拟复杂的模型在邻近区域的行为。最终,LIME提供了一个简单的模型来解释复杂模型的行为,这使得可视化和解释变得直观易懂。
## 2.3 模型简化与原型解释
模型简化与原型解释是指通过简化模型复杂度或构造原型来增加神经网络模型的可解释性。此方法旨在减少模型的复杂性,同时尽可能保持其性能。
### 2.3.1 网络剪枝技术
网络剪枝技术通过移除网络中不必要的或冗余的参数(如权重和神经元),来简化网络模型。它有助于降低模型复杂度、提高运算效率,同时通过观察剪枝前后模型性能的变化来帮助理解哪些参数对模型预测更重要。
**网络剪枝代码示例:**
```python
from keras import models
from keras import backend as K
def prune_network(model, density):
new_model = models.clone_model(model)
new_model.set_weights(model.get_weights())
# 将随机选择的一部分权重设置为零
weights = new_model.get_weights()
new_weights = []
for layer in weights:
layer_shape = layer.shape
layer_flat = layer.reshape(-1)
density_mask = np.random.binomial(1, density, layer_flat.shape).astype(bool)
layer_flat[density_mask] = 0
new_layer = layer_flat.reshape(layer_shape)
new_weights.append(new_layer)
new_model.set_weights(new_weights)
return new_model
# 应用网络剪枝技术
pruned_model = prune_network(
```

 百万级
高质量VIP文章无限畅学
百万级
高质量VIP文章无限畅学
 千万级
优质资源任意下载
千万级
优质资源任意下载
 C知道
免费提问 ( 生成式Al产品 )
C知道
免费提问 ( 生成式Al产品 )
0
0
相关推荐

专栏简介
本专栏深入探讨神经网络模型的可解释性,揭示了提升模型透明度的秘诀。从实战指南到工具箱,专栏提供了全面的资源,帮助读者了解神经网络的内部运作原理。通过分析性能与透明度的权衡,专栏探讨了可解释性的重要性,并提供了构建可解释深度学习模型的终极指南。此外,专栏还提供了实践案例和技术策略,帮助构建可解释的 AI 系统。通过艺术与科学的结合,专栏深入剖析了神经网络可解释性技术的深度,并提供了克服挑战和提升透明度的实战技巧。
专栏目录
最低0.47元/天 解锁专栏
买1年送3月
百万级
高质量VIP文章无限畅学
千万级
优质资源任意下载
C知道
免费提问 ( 生成式Al产品 )
最新推荐
跨平台推荐系统:实现多设备数据协同的解决方案

# 1. 跨平台推荐系统概述
## 1.1 推荐系统的演变与发展
推荐系统的发展是随着互联网内容的爆炸性增长和用户个性化需求的提升而不断演进的。最初,推荐系统主要基于规则来实现,而后随着数据量的增加和技术的进步,推荐系统转向以数据驱动为主,使用复杂的算法模型来分析用户行为并预测偏好。如今,跨平台推荐系统正逐渐成为研究和应用的热点,旨
图像融合技术实战:从理论到应用的全面教程
# 1. 图像融合技术概述
随着信息技术的快速发展,图像融合技术已成为计算机视觉、遥感、医学成像等多个领域关注的焦点。**图像融合**,简单来说,就是将来自不同传感器或同一传感器在不同时间、不同条件下的图像数据,经过处理后得到一个新的综合信息。其核心目标是实现信息的有效集成,优化图像的视觉效果,增强图像信息的解释能力或改善特定任务的性能。
从应用层面来看,图像融合技术主要分为三类:**像素级**融合,直接对图
优化之道:时间序列预测中的时间复杂度与模型调优技巧
# 1. 时间序列预测概述
在进行数据分析和预测时,时间序列预测作为一种重要的技术,广泛应用于经济、气象、工业控制、生物信息等领域。时间序列预测是通过分析历史时间点上的数据,以推断未来的数据走向。这种预测方法在决策支持系统中占据着不可替代的地位,因为通过它能够揭示数据随时间变化的规律性,为科学决策提供依据。
时间序列预测的准确性受到多种因素的影响,例如数据
【商业化语音识别】:技术挑战与机遇并存的市场前景分析
# 1. 商业化语音识别概述
语音识别技术作为人工智能的一个重要分支,近年来随着技术的不断进步和应用的扩展,已成为商业化领域的一大热点。在本章节,我们将从商业化语音识别的基本概念出发,探索其在商业环境中的实际应用,以及如何通过提升识别精度、扩展应用场景来增强用户体验和市场竞争力。
## 1.1 语音识别技术的兴起背景
语音识别技术将人类的语音信号转化为可被机器理解的文本信息,它
【循环神经网络】:TensorFlow中RNN、LSTM和GRU的实现

# 1. 循环神经网络(RNN)基础
在当今的人工智能领域,循环神经网络(RNN)是处理序列数据的核心技术之一。与传统的全连接网络和卷积网络不同,RNN通过其独特的循环结构,能够处理并记忆序列化信息,这使得它在时间序列分析、语音识别、自然语言处理等多
【图像分类模型自动化部署】:从训练到生产的流程指南
# 1. 图像分类模型自动化部署概述
在当今数据驱动的世界中,图像分类模型已经成为多个领域不可或缺的一部分,包括但不限于医疗成像、自动驾驶和安全监控。然而,手动部署和维护这些模型不仅耗时而且容易出错。随着机器学习技术的发展,自动化部署成为了加速模型从开发到生产的有效途径,从而缩短产品上市时间并提高模型的性能和可靠性。
本章旨在为读者提供自动化部署图像分类模型的基本概念和流程概览,
硬件加速在目标检测中的应用:FPGA vs. GPU的性能对比
# 1. 目标检测技术与硬件加速概述
目标检测技术是计算机视觉领域的一项核心技术,它能够识别图像中的感兴趣物体,并对其进行分类与定位。这一过程通常涉及到复杂的算法和大量的计算资源,因此硬件加速成为了提升目标检测性能的关键技术手段。本章将深入探讨目标检测的基本原理,以及硬件加速,特别是FPGA和GPU在目标检测中的作用与优势。
## 1.1 目标检测技术的演进与重要性
目标检测技术的发展与深度学习的兴起紧密相关
PyTorch超参数调优:专家的5步调优指南
# 1. PyTorch超参数调优基础概念
## 1.1 什么是超参数?
在深度学习中,超参数是模型训练前需要设定的参数,它们控制学习过程并影响模型的性能。与模型参数(如权重和偏置)不同,超参数不会在训练过程中自动更新,而是需要我们根据经验或者通过调优来确定它们的最优值。
## 1.2 为什么要进行超参数调优?
超参数的选择直接影响模型的学习效率和最终的性能。在没有经过优化的默认值下训练模型可能会导致以下问题:
- **过拟合**:模型在
NLP数据增强神技:提高模型鲁棒性的六大绝招

# 1. NLP数据增强的必要性
自然语言处理(NLP)是一个高度依赖数据的领域,高质量的数据是训练高效模型的基础。由于真实世界的语言数据往往是有限且不均匀分布的,数据增强就成为了提升模型鲁棒性的重要手段。在这一章中,我们将探讨NLP数据增强的必要性,以及它如何帮助我们克服数据稀疏性和偏差等问题,进一步推
【Python可视化新境界】:Scikit-learn绘制学习曲线与特征重要性图

# 1. Python可视化基础与Scikit-learn概述
Python是当今最流行的编程语言之一,尤其在数据科学领域。它不仅因为其简洁的语法和强大的库而受到赞誉,也因为其强大的数据可视化能力,为数据探索和分析提供了极佳的工具。数据可视化使我们能够以直观的方式理解复杂的数据集合,而Python的各种库,如Matplotlib、Seaborn和Plotly等,提供了丰富的接
资源上传下载、课程学习等过程中有任何疑问或建议,欢迎提出宝贵意见哦~我们会及时处理!
点击此处反馈


专栏目录
最低0.47元/天 解锁专栏
买1年送3月
百万级
高质量VIP文章无限畅学
千万级
优质资源任意下载
C知道
免费提问 ( 生成式Al产品 )