时序图在制造业中的应用:生产、质量、供应链,智能制造
发布时间: 2024-07-20 15:45:27 阅读量: 131 订阅数: 32 

快速学习时序图:时序图简介、画法及实例

# 1. 时序图简介**
时序图是一种可视化建模技术,用于描述和分析系统或流程中的事件序列。它以时间轴为基础,显示事件之间的顺序、持续时间和依赖关系。时序图广泛应用于软件开发、制造业和业务流程建模等领域。
时序图的元素包括:
* **事件:**系统或流程中发生的特定动作或状态变化。
* **消息:**在事件之间传递的信息或数据。
* **时间轴:**表示事件发生的顺序和持续时间。
* **泳道:**表示系统或流程中不同的参与者或组件。
# 2. 时序图在生产管理中的应用
时序图在生产管理中发挥着至关重要的作用,它通过可视化生产流程和数据,帮助企业优化生产流程、提高生产质量和效率。
### 2.1 生产流程建模与分析
#### 2.1.1 时序图描述生产流程
时序图可以清晰地描述生产流程的各个阶段,包括原材料采购、生产准备、生产过程、成品检验和交付。通过时序图,企业可以直观地了解生产流程的整体架构,识别不同阶段之间的依赖关系和时间顺序。
```mermaid
sequenceDiagram
participant 生产准备
participant 生产过程
participant 成品检验
participant 交付
生产准备->生产过程: 开始生产
生产过程->成品检验: 生产完成
成品检验->交付: 检验合格
```
**代码逻辑解读:**
* `participant` 定义参与生产流程的参与者。
* `->` 表示消息传递的方向。
* `开始生产`、`生产完成`、`检验合格` 表示生产流程中的关键事件。
#### 2.1.2 识别生产瓶颈和优化流程
通过分析时序图,企业可以识别生产流程中的瓶颈,即生产速度最慢的阶段。通过优化瓶颈阶段,例如增加产能或改善工艺流程,企业可以提高整体生产效率。
**优化方式:**
* 增加瓶颈阶段的产能,例如增加设备或人员。
* 改善瓶颈阶段的工艺流程,例如优化生产线布局或减少等待时间。
### 2.2 生产质量监控
#### 2.2.1 时序图监控生产数据
时序图可以用来监控生产过程中的关键数据,例如产量、合格率和生产时间。通过实时监控这些数据,企业可以及时发现生产质量问题,并采取纠正措施。
```python
import matplotlib.pyplot as plt
# 生产数据
production_data = [
[100, 95, 90, 85, 80], # 产量
[98, 96, 94, 92, 90], # 合格率
[120, 115, 110, 105, 100] # 生产时间
]
# 绘制时序图
plt.figure(figsize=(10, 6))
plt.plot(production_data[0], label="产量")
plt.plot(production_data[1], label="合格率")
plt.plot(production_data[2], label="生产时间")
plt.xlabel("时间")
plt.ylabel("值")
plt.legend()
plt.show()
```
**代码逻辑解读:**
* `matplotlib.pyplot` 用于绘制时序图。
* `production_data` 是一个列表,其中包含产量、合格率和生产时间的数据。
* `plt.plot()` 函数绘制时序图。
* `plt.xlabel()` 和 `plt.ylabel()` 设置 x 轴和 y 轴标签。
* `plt.legend()` 添加图例。
* `plt.show()` 显示时序图。
#### 2.2.2 识别质量缺陷和采取纠正措施
通过分析时序图,企业可以识别生产过程中出现的质量缺陷,例如合格率下降或生产时间增加。通过调查缺陷原因并采取纠正措施,企业可以提高生产质量和减少损失。
**纠正措施:**
* 加强质量控制,例如增加检验频率或使用更严格的检验标准。
* 改善生产工艺,例如优化设备参数或更换原材料。
* 培训操作人员,提高他们的质量意识和技能。
# 3. 时序图在质量管理中的应用
时序图在质量管理领域有着广泛的应用,它可以帮助企业深入分析质量问题,优化质量控制流程,从而提升产品质量和生产效率。
### 3.1 质量问题分析
#### 3.1.1 时序图追踪质量问题根源
时序图可以用来追踪质量问题发生的整个过程,帮助企业快速找出问题根源。通过绘制时序图,企业可以直观地展示质量问题发生的时间、地点、人员和相关事件,从而找出问题发生的触发因素和影响因素。
**代码块:**
```mermaid
sequenceDiagram
participant User as U
participant System as S
U->S: Submits request
S->U: Processes request
U->S: Receives response
S->U: Sends error message
```
**逻辑分析:**
该时序图描述了用户向系统提交请求并收到错误消息的过程。通过分析时序图,我们可以看到:
* 用户在提交请求后,系统进行了处理。
* 系统在处理请求时遇到了错误。
* 系统将错误消

 百万级
高质量VIP文章无限畅学
百万级
高质量VIP文章无限畅学
 千万级
优质资源任意下载
千万级
优质资源任意下载
 C知道
免费提问 ( 生成式Al产品 )
C知道
免费提问 ( 生成式Al产品 )
0
0
相关推荐

专栏简介
《时序图》专栏深入剖析时序图,从 UML 到设计模式的应用实战,全面揭秘其在软件设计、敏捷开发、分布式系统、实时系统、云计算、数据分析、用户体验设计、业务流程建模、系统工程、医疗保健、制造业、教育和研究中的妙用。专栏还比较了时序图与 UML、BPMN 和 ERD 等建模工具,探讨了其在协作、效率、实时掌控、洞察数据、提升用户体验、流程优化、系统开发、健康保障、智能制造、教育创新和科研利器等方面的价值。通过最佳实践、自动化技术和案例分析,专栏旨在帮助读者充分利用时序图,打造可读、可维护和一致的时序图,提升软件开发、业务流程优化和系统工程的效率和质量。
专栏目录
最低0.47元/天 解锁专栏
买1年送3月
百万级
高质量VIP文章无限畅学
千万级
优质资源任意下载
C知道
免费提问 ( 生成式Al产品 )
最新推荐
自动化统计:组态王脚本编写技巧及运行时间记录
# 摘要
本文系统地介绍了组态王脚本的基础知识、编写核心理论、实践操作技巧、运行时间记录与分析方法、高级应用以及案例研究与实战演练。首先概述了组态王脚本的基本概念和自动化统计的重要性。随后,深入讲解了脚本语言的基础理论,包括语法结构、变量和数据类型,以及逻辑控制、模块化编程和代码重用。在实践操作技巧方面,文章阐述了数据采集处理、用户交互界面更新和脚本异常处理等关键技术。进一步地,本文详细
FEMAPA项目周期规划:专家教你如何有效管理
# 摘要
FEMAPA项目周期规划的理论基础和实践应用是现代项目管理的重要组成部分。本文深入探讨了项目从启动、规划、执行、监控到收尾和评估的全过程。通过分析项目启动的重要性与方法,以及项目规划的策略与步骤,本文强调了明确项目目标与范围和创建项目工作分解结构(WBS)的重要性。在执行与监控阶段,本文讨论了如何进行有效的团队协作
SEED-XDS200故障诊断手册:常见问题及解决方案
# 摘要
本文全面概述了SEED-XDS200故障诊断的各个方面,包括硬件问题、软件故障以及通信故障的诊断与修复流程。文章详细分析了SEED-XDS200的硬件结构,并提出了硬件故障的诊断方法和维修建议。同时,对软件系统进行了深入探讨,包括软件故障的诊断技术、修复步骤及性能调优技巧。此外,本文还涉及了通信协议的标准和问题,以及
【移动端适配技术研究】:利用viewport打造无缝竖屏体验

# 摘要
随着智能手机和平板电脑的普及,移动端适配技术成为了网页设计和前端开发中的关键课题。本文全面概述了移动端适配技术的基础知识,并深入探讨了viewport的作用与属性、响应式设计的实现方法、以及viewport在实战中的应用技巧。文章还分析了移动端适配技术的进阶实践
【激光器设计必修课】:原理深入与组件选择秘笈

# 摘要
本文详细介绍了激光器的工作原理、关键组件以及设计理论基础。首先,文章阐述了激光器的工作原理,并对其核心组件进行了深入分析,包括不同类型的激光增益介质和泵浦源技术。接着,本文探讨了光学共振理论和激光束传播理论,强调了谐振腔稳定性分析的重要性。第四章聚焦于激光器性能的评估与测试方法,包括功率和能量测量、光谱特性分析以及时间特性分析。第五章探讨了激光器组件的选型与应用,提供了选择增益介质
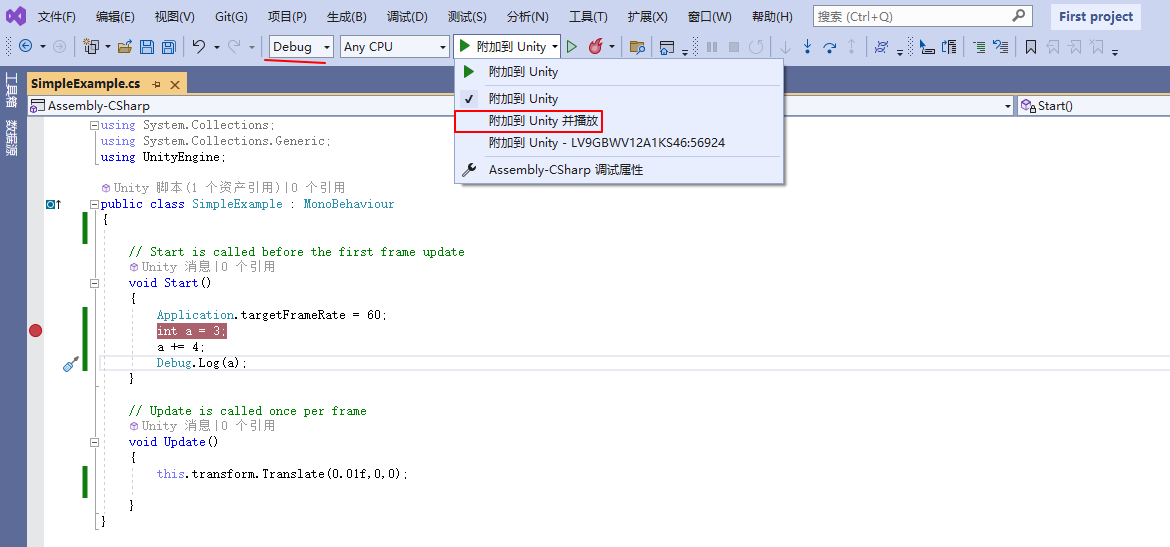
STM32故障无处藏身:J-Flash与J-link的故障诊断与备份恢复技巧
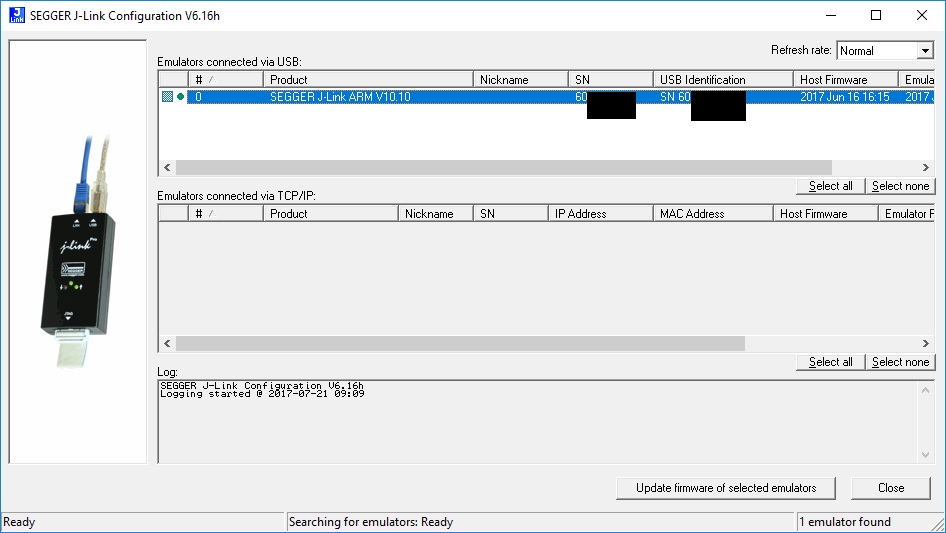
# 摘要
本文全面探讨了STM32微控制器的故障诊断与备份恢复技术,首先概述了STM32故障的类型和特点,同时介绍了J-Flash和J-link这两种常用的诊断工具。文章深入分析了故障诊断的理论基础和实践操作,包括故障诊断流程、工具使用技巧以及自动化测试脚本的应用。随后,文章阐述了备份数据的重要性,详细描述了J-Flash与J-link的备份操作和恢复流程。此外,本文还介绍了备份恢复的高级
Scratch与物联网融合:创造连接现实与虚拟的编程项目(探索真实世界的编程)
# 摘要
本文旨在探讨Scratch编程与物联网项目的结合,通过系统性介绍Scratch编程简介和物联网基础,阐述物联网项目设计与规划过程中的需求分析、系统架构设计以及技术选择。文章深入分析了Scratch
揭秘控制系统的奥秘:谢红卫版习题全解析与实践技巧

# 摘要
控制系统的理论基础是自动化和信息技术的核心组成部分,涉及其数学模型、分析、设计、仿真以及实践操作。本文首先回顾了控制系统的理论基
单目到双目的跨越:4个步骤实现单目标定到双目标定的迁移

# 摘要
本文全面探讨了单目和双目视觉系统的标定过程及其理论基础,详细介绍了单目视觉系统标定的理论与实践步骤,以及双目视觉系统的标定原理和操作。文章进一步阐述了
资源上传下载、课程学习等过程中有任何疑问或建议,欢迎提出宝贵意见哦~我们会及时处理!
点击此处反馈


专栏目录
最低0.47元/天 解锁专栏
买1年送3月
百万级
高质量VIP文章无限畅学
千万级
优质资源任意下载
C知道
免费提问 ( 生成式Al产品 )