时序图在研究中的应用:科学、数据、协作,科研利器
发布时间: 2024-07-20 15:50:55 阅读量: 67 订阅数: 32 

时序图、活动图、状态图、协作图的区别
# 1. 时序图简介**
时序图是一种可视化工具,用于表示数据随时间变化的情况。它以时间为横轴,数据值或其他相关变量为纵轴,通过线条或其他图形元素连接数据点,形成一条连续的曲线或折线图。时序图可以清晰地展示数据的趋势、周期性和异常值,帮助用户快速理解和分析数据。
时序图在科学研究中有着广泛的应用,包括数据分析、模型构建和数据协作。在数据分析中,时序图可以帮助识别数据中的模式、趋势和异常值,为进一步的数据探索和挖掘提供基础。在模型构建中,时序图可以用于描述复杂系统的行为,并作为预测和仿真模型的基础。
# 2. 时序图在科学研究中的应用
时序图在科学研究中发挥着至关重要的作用,为研究人员提供了一种可视化和分析时间序列数据的强大工具。在本章中,我们将探讨时序图在数据分析和模型构建中的应用。
### 2.1 时序图在数据分析中的作用
#### 2.1.1 数据可视化和探索
时序图是可视化时间序列数据的一种有效方式,使研究人员能够快速识别模式、趋势和异常值。通过将数据点绘制在时间轴上,时序图可以揭示数据的变化和周期性,从而帮助研究人员形成对数据的初步理解。
#### 2.1.2 数据模式识别和趋势分析
时序图可以帮助研究人员识别数据中的模式和趋势。通过观察数据的波动和变化,研究人员可以识别周期性、季节性或其他模式。这些模式可以提供对数据行为的见解,并有助于预测未来的趋势。
### 2.2 时序图在模型构建中的应用
#### 2.2.1 复杂系统建模
时序图可用于对复杂系统进行建模,例如生态系统、经济系统或社会系统。通过将系统中的不同变量绘制在时间轴上,研究人员可以识别变量之间的关系和相互作用。这可以帮助他们了解系统的动态行为并预测未来的结果。
#### 2.2.2 预测和仿真
时序图还可以用于预测和仿真。通过分析历史数据,研究人员可以创建预测模型来预测未来的趋势。这些模型可用于评估不同的情景并制定数据驱动的决策。
**代码块 1:使用 Python 绘制时序图**
```python
import matplotlib.pyplot as plt
# 数据
time = [1, 2, 3, 4, 5]
values = [10, 20, 30, 40, 50]
# 绘制时序图
plt.plot(time, values)
plt.xlabel('Time')
plt.ylabel('Value')
plt.ti
```

 百万级
高质量VIP文章无限畅学
百万级
高质量VIP文章无限畅学
 千万级
优质资源任意下载
千万级
优质资源任意下载
 C知道
免费提问 ( 生成式Al产品 )
C知道
免费提问 ( 生成式Al产品 )
0
0
相关推荐

专栏简介
《时序图》专栏深入剖析时序图,从 UML 到设计模式的应用实战,全面揭秘其在软件设计、敏捷开发、分布式系统、实时系统、云计算、数据分析、用户体验设计、业务流程建模、系统工程、医疗保健、制造业、教育和研究中的妙用。专栏还比较了时序图与 UML、BPMN 和 ERD 等建模工具,探讨了其在协作、效率、实时掌控、洞察数据、提升用户体验、流程优化、系统开发、健康保障、智能制造、教育创新和科研利器等方面的价值。通过最佳实践、自动化技术和案例分析,专栏旨在帮助读者充分利用时序图,打造可读、可维护和一致的时序图,提升软件开发、业务流程优化和系统工程的效率和质量。
专栏目录
最低0.47元/天 解锁专栏
买1年送3月
百万级
高质量VIP文章无限畅学
千万级
优质资源任意下载
C知道
免费提问 ( 生成式Al产品 )
最新推荐
酒店客房状态流转活动图分析:掌握流程优化的秘诀

# 摘要
本文旨在深入分析酒店客房状态流转,并探讨活动图理论在实践中的应用。首先,介绍了活动图的基本概念、作用及其与传统流程图的区别。随后,本研究通过具体案例分析,展示了活动图在客房状态流转中的绘制和实际操作流程,强调了活动图在发现流程瓶颈和流程优化中的实用价值。同时,本文探讨了活动图分析的高级技巧,如层次化设计、时间约束以及跨部门协同应用等,并预测了活动图在数字化转型、智能化发展以及
Matlab中的Broyden方法:代码优化与调试的顶级教程

# 摘要
Broyden方法是一种高效的迭代算法,用于解决非线性方程组的根问题,特别适用于大规模问题。本文首先介绍了Broyden方法的基本概念和原理,随后深入探讨了其理论基础和数学模型,
SMBus性能调优秘籍:系统间通信效率的极致提升
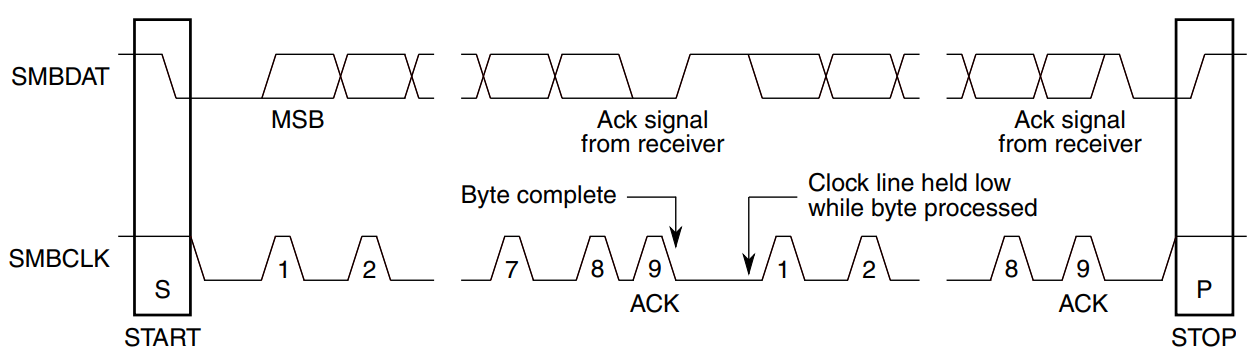
# 摘要
本论文全面介绍了SMBus技术的概述、协议原理、性能优化策略、性能测试与评估,以及在高性能计算中的应用案例。首先概述了SMBus的基本概念及其在不同场景下的应用。随后深入解析了SMBus协议的通信机制、数据传输过程、故障诊断方法。紧接着,文章探讨了通过硬件加速、软件优化和网络架构调整等方式来提升SMBus性能的策略。此外,通过对性能测试工具和方法的介绍,以及对性能数据分析与解读的详述,本论文还探讨
HALCON基础教程:轻松掌握23.05版本HDevelop操作符(专家级指南)

# 摘要
本文全面介绍HALCON 23.05版本HDevelop环境及其图像处理、分析和识别技术。首先概述HDevelop开发环境的特点,然后深入探讨HALCON在图像处理领域的基础操作,如图像读取、显示、基本操作、形态学处理等。第三章聚焦于图像分析与识别技术,包括边缘和轮廓检测、图像分割与区域分析、特征提取与匹配。在第四章中,本文转向三维视觉处理,介绍三维
哈工大人工智能实验报告:掌握数据预处理,优化你的机器学习模型
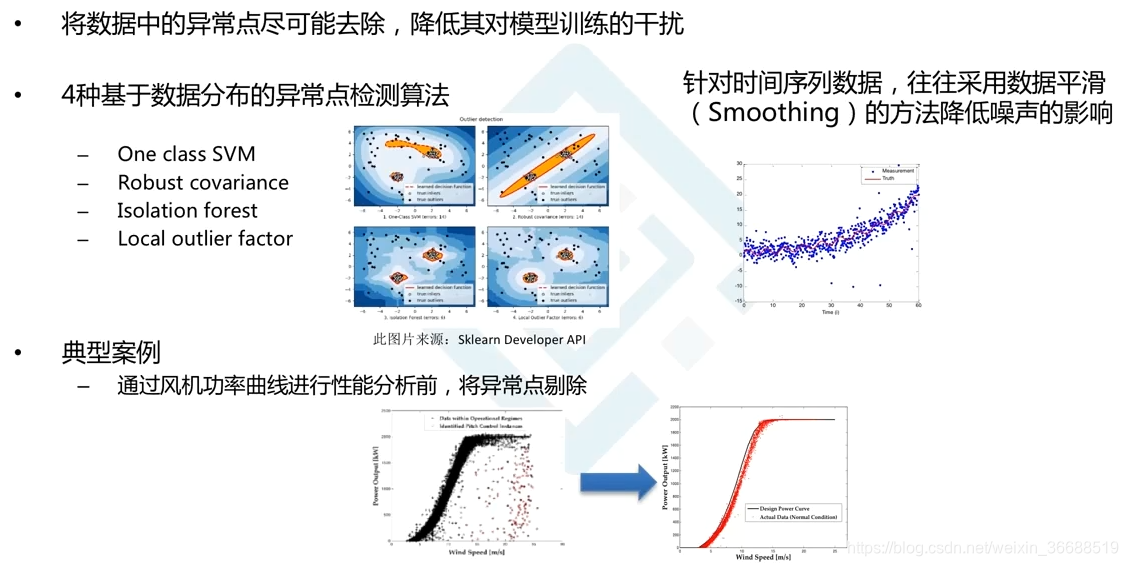
# 摘要
数据预处理作为机器学习流程中的核心步骤,对提高模型性能具有决定性影响。本文首先讨论了数据预处理的重要性,并概述了其在增强
STM32引脚冲突不再有:专家揭秘如何避免和处理资源争用
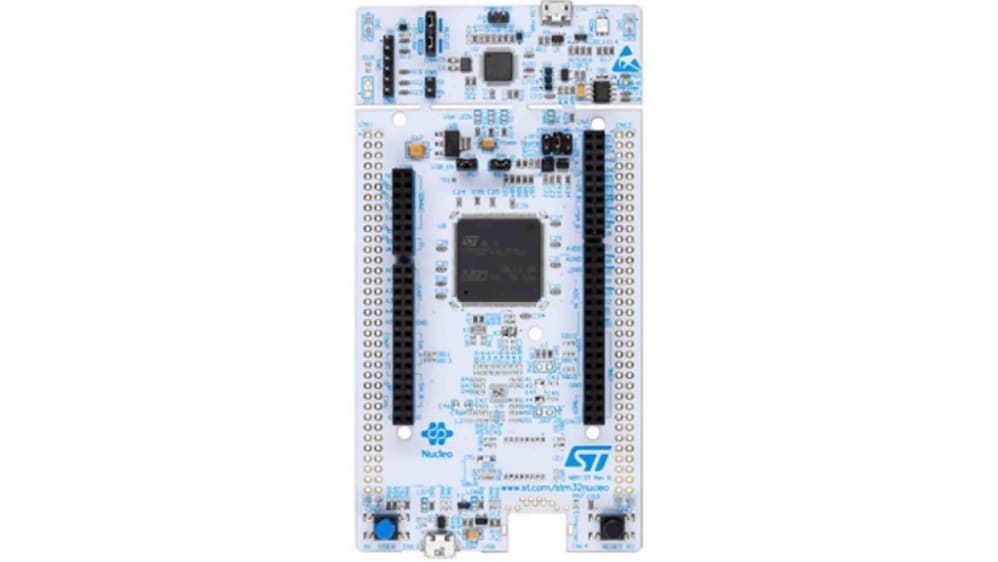
# 摘要
本文详细探讨了STM32微控制器中引脚冲突和资源争用的问题,包括其理论基础、实践操作和高级技术应用。文章首先介绍了STM32的GPIO特性,然后分析了引脚冲突的成因及其对系统稳定性的影响。接着,文章提出了理论上的解决策略,并在实践中探讨了软件配置和硬件设计中的具体操作。高级技巧与工具应用章节讨论了
【浪潮英信NF5460M4安装完全指南】:新手也能轻松搞定
# 摘要
本文详细介绍了浪潮英信NF5460M4服务器的安装、配置、管理和性能优化过程。首先概述了服务器的基本信息和硬件安装步骤,包括准备工作、物理安装以及初步硬件设置。接着深入讨论了操作系统的选择、安装流程以及基础系统配置和优化。此外,本文还包含了服务器管理与维护的最佳实践,如硬件监控、软件更新与补丁管理以及故障排除支持。最后,通过性能测试与优化建议章节,本文提供了测试工具介绍、性能调优实践和长期维护升级规划,旨在帮助用户最大化服务器性能并确保稳定运行。
# 关键字
服务器安装;操作系统配置;硬件监控;软件更新;性能测试;故障排除
参考资源链接:[浪潮英信NF5460M4服务器全面技术手
【深度剖析】:掌握WindLX:完整用户界面与功能解读,打造个性化工作空间
# 摘要
本文全面介绍了WindLX用户界面的掌握方法、核心与高级功能详解、个性化工作空间的打造技巧以及深入的应用案例研究。通过对界面定制能力、应用管理、个性化设置等核心功能的详细解读,以及窗口管理、集成开发环境支持和多显示器设置等高级功能的探索,文章为用户提供了全面的WindLX使用指导。同时,本文还提供了实际工作
资源上传下载、课程学习等过程中有任何疑问或建议,欢迎提出宝贵意见哦~我们会及时处理!
点击此处反馈


专栏目录
最低0.47元/天 解锁专栏
买1年送3月
百万级
高质量VIP文章无限畅学
千万级
优质资源任意下载
C知道
免费提问 ( 生成式Al产品 )