信号分析中的因果关系分析:揭示信号之间的依赖关系,预测未来趋势
发布时间: 2024-07-10 11:44:39 阅读量: 97 订阅数: 36 

msGC.zip_dugweg_granger_msgctxt_因果关系分析_国嵌 msg.c

# 1. 信号分析基础
信号分析是研究信号特征和规律的一门学科,在信号处理、通信、控制等领域有着广泛的应用。信号分析基础包括信号的分类、信号的时域和频域分析、信号的变换等内容。
### 1.1 信号的分类
信号可以根据其性质和用途进行分类,常见的信号类型包括:
- 连续信号:连续变化的信号,如正弦波、三角波等。
- 离散信号:以离散时间或离散幅度变化的信号,如数字信号、脉冲信号等。
- 模拟信号:连续变化的信号,如声音、图像等。
- 数字信号:离散时间和幅度的信号,如二进制信号、数字图像等。
### 1.2 信号的时域和频域分析
信号的时域分析是指研究信号在时间域上的变化规律,常用的时域分析方法包括:
- 时域波形分析:直接观察信号在时间域上的变化形态。
- 相关分析:计算信号与自身或其他信号的时移相关性。
- 谱分析:计算信号在不同频率下的功率分布。
# 2. 因果关系分析理论
### 2.1 格兰杰因果关系
#### 2.1.1 格兰杰因果关系的定义和原理
格兰杰因果关系是一种统计检验方法,用于确定两个时间序列之间是否存在因果关系。其基本原理是:如果一个时间序列的过去值可以预测另一个时间序列的未来值,那么第一个时间序列就被认为是第二个时间序列的格兰杰原因。
**定义:**
如果时间序列 X 的过去值可以显著改善对时间序列 Y 未来值的预测,则称 X 是 Y 的格兰杰原因。
**原理:**
格兰杰因果关系检验基于以下假设:
* 时间序列是平稳的。
* 时间序列之间没有协整关系。
* 时间序列之间不存在自相关或异方差性。
#### 2.1.2 格兰杰因果关系检验方法
格兰杰因果关系检验通常采用以下步骤:
1. **建立自回归模型:**
* 对于时间序列 X,建立自回归模型:X(t) = α + β1X(t-1) + β2X(t-2) + ... + ε(t)
* 对于时间序列 Y,建立自回归模型:Y(t) = γ + δ1Y(t-1) + δ2Y(t-2) + ... + η(t)
2. **加入滞后项:**
* 在 X 的自回归模型中加入 Y 的滞后项:X(t) = α + β1X(t-1) + β2X(t-2) + ... + γ1Y(t-1) + γ2Y(t-2) + ... + ε(t)
* 在 Y 的自回归模型中加入 X 的滞后项:Y(t) = γ + δ1Y(t-1) + δ2Y(t-2) + ... + α1X(t-1) + α2X(t-2) + ... + η(t)
3. **比较模型:**
* 比较加入滞后项后的模型与不加入滞后项的模型的残差平方和。
* 如果加入滞后项后残差平方和显著减小,则表明 X 是 Y 的格兰杰原因。
### 2.2 信息论因果关系
#### 2.2.1 互信息和条件互信息
**互信息:**
互信息衡量两个随机变量之间的依赖程度。其定义为:
```
I(X; Y) = H(X) + H(Y) - H(X, Y)
```
其中:
* H(X) 和 H(Y) 分别是 X 和 Y 的熵。
* H(X, Y) 是 X 和 Y 的联合熵。
互信息越大,X 和 Y 之间的依赖程度越高。
**条件互信息:**
条件互信息衡量在给定另一个变量的情况下,两个随机变量之间的依赖程度。其定义为:
```
I(X; Y | Z) = H(X | Z) + H(Y | Z) - H(X, Y | Z)
```
其中:
* H(X | Z) 和 H(Y | Z) 分别是 X 和 Y 在给定 Z 时的条件熵。
* H(X, Y | Z) 是 X 和 Y 在给定 Z 时的联合条件熵。
条件互信息越大,在给定 Z 的情况下,X 和 Y 之间的依赖程度越高。
#### 2.2.2 距离相关系数
距离相关系数是一种非参数度量,用于衡量两个随机变量之间的依赖程度。其定义为:
```
dCov(X, Y) = ||X - E(X)|| ||Y - E(Y)||
```
其中:
* E(X) 和 E(Y) 分别是

 百万级
高质量VIP文章无限畅学
百万级
高质量VIP文章无限畅学
 千万级
优质资源任意下载
千万级
优质资源任意下载
 C知道
免费提问 ( 生成式Al产品 )
C知道
免费提问 ( 生成式Al产品 )
0
0
相关推荐

专栏简介
信号分析专栏为您提供信号处理领域的全面指南,从入门基础到高级技术。专栏涵盖各种主题,包括:
* **傅里叶变换:**揭示信号的频率成分,是信号处理的基石。
* **时频分析:**探索信号在时域和频域上的变化,揭示隐藏的模式。
* **小波变换:**深入时频域,揭示信号的局部特征。
* **相关性和谱密度:**理解信号的特性和规律,洞察信号之间的联系。
* **降噪技术:**去除干扰,还原信号的真实信息。
* **分类和聚类:**探索信号的模式和相似性,揭示隐藏的联系。
* **图像处理:**从图像中提取有价值的信息,洞察图像的奥秘。
* **语音处理:**识别和分析语音信号,解锁人机交互的新境界。
* **生物医学应用:**探索生理信号的奥秘,助力医疗诊断。
* **工业应用:**提高生产效率和质量,推动工业智能化。
* **通信应用:**优化网络性能和可靠性,畅享高速稳定通信。
* **交通应用:**改善交通流量和安全性,畅通城市脉络。
* **时间序列分析:**预测和理解时间序列数据,把握未来走向。
* **因果关系分析:**揭示信号之间的依赖关系,预测未来趋势。
通过深入浅出的讲解和丰富的案例,本专栏将帮助您掌握信号分析的精髓,解锁信号处理的强大功能。
专栏目录
最低0.47元/天 解锁专栏
买1年送3月
百万级
高质量VIP文章无限畅学
千万级
优质资源任意下载
C知道
免费提问 ( 生成式Al产品 )
最新推荐
深入浅出Java天气预报应用开发:零基础到项目框架搭建全攻略

# 摘要
Java作为一种流行的编程语言,在开发天气预报应用方面显示出强大的功能和灵活性。本文首先介绍了Java天气预报应用开发的基本概念和技术背景,随后深入探讨了Java基础语法和面向对象编程的核心理念,这些为实现天气预报应用提供了坚实的基础。接着,文章转向Java Web技术的应用,包括Servlet与JSP技术基础、前端技术集成和数据库交互技术。在
【GPO高级管理技巧】:提升域控制器策略的灵活性与效率
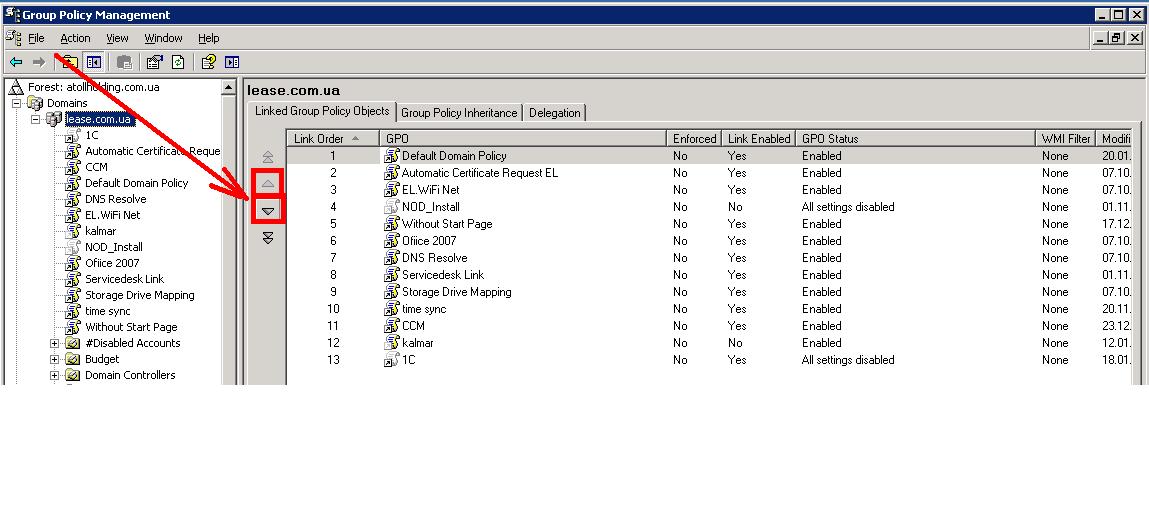
# 摘要
本论文全面介绍了组策略对象(GPO)的基本概念、策略设置、高级管理技巧、案例分析以及安全策略和自动化管理。GPO作为一种在Windows域环境中管理和应用策略的强大工具,广泛应用于用户配置、计算机配置、安全策略细化与管理、软件安装与维护。本文详细讲解了策略对象的链接与继承、WMI过滤器的使用以及GPO的版本控制与回滚策略,同时探讨了跨域策略同步、脚本增强策略灵活性以及故障排除与
高级CMOS电路设计:传输门创新应用的10个案例分析

# 摘要
本文全面介绍了CMOS电路设计基础,特别强调了传输门的结构、特性和在CMOS电路中的工作原理。文章深入探讨了传输门在高速数据传输、模拟开关应用、低功耗设计及特殊功能电路中的创新应用案例,以及设计优化面临的挑战,包括噪声抑制、热效应管理,以及传输门的可靠性分析。此外,本文展望了未来CMOS技术与传输门相结合的趋势,讨论了新型
计算机组成原理:指令集架构的演变与影响

# 摘要
本文综合论述了计算机组成原理及其与指令集架构的紧密关联。首先,介绍了指令集架构的基本概念、设计原则与分类,详细探讨了CISC、RISC架构特点及其在微架构和流水线技术方面的应用。接着,回顾了指令集架构的演变历程,比较了X86到X64的演进、RISC架构(如ARM、MIPS和PowerPC)的发展,以及SIMD指令集(例如AVX和NEON)的应用实例。文章进一步分析了指令集
KEPServerEX秘籍全集:掌握服务器配置与高级设置(最新版2018特性深度解析)
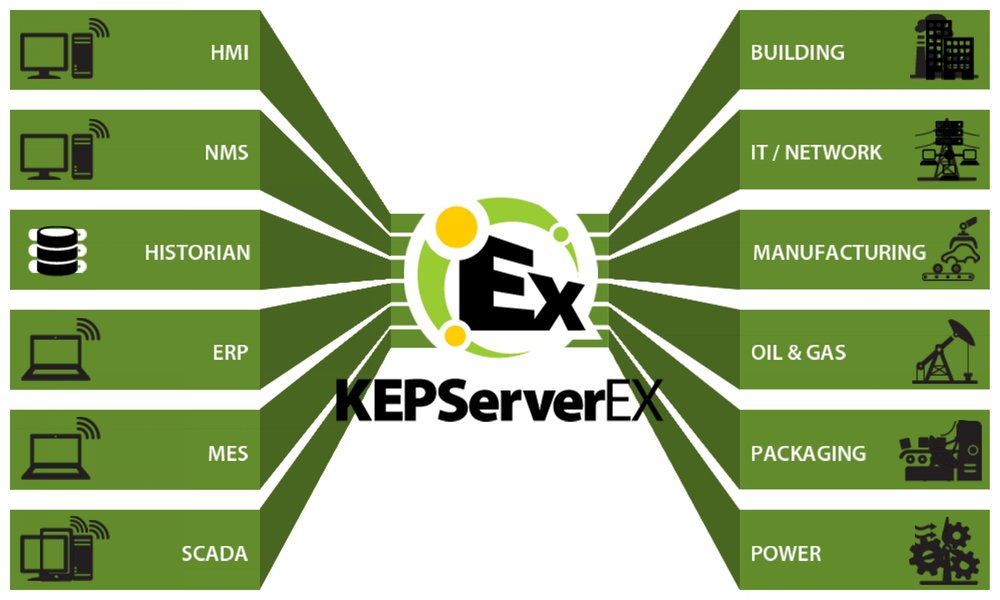
# 摘要
KEPServerEX作为一种广泛使用的工业通信服务器软件,为不同工业设备和应用程序之间的数据交换提供了强大的支持。本文从基础概述入手,详细介绍了KEPServerEX的安装流程和核心特性,包括实时数据采集与同步,以及对通讯协议和设备驱动的支持。接着,文章深入探讨了服务器的基本配置,安全性和性能优化的高级设
TSPL2批量打印与序列化大师课:自动化与效率的完美结合

# 摘要
TSPL2是一种广泛应用于打印和序列化领域的技术。本文从基础入门开始,详细探讨了TSPL2的批量打印技术、序列化技术以及自动化与效率提升技巧。通过分析TSPL2批量打印的原理与优势、打印命令与参数设置、脚本构建与调试等关键环节,本文旨在为读者提供深入理解和应用TSPL2技术的指
【3-8译码器构建秘籍】:零基础打造高效译码器

# 摘要
3-8译码器是一种广泛应用于数字逻辑电路中的电子组件,其功能是从三位二进制输入中解码出八种可能的输出状态。本文首先概述了3-8译码器的基本概念及其工作原理,并
EVCC协议源代码深度解析:Gridwiz代码优化与技巧
# 摘要
本文全面介绍了EVCC协议和Gridwiz代码的基础结构、设计模式、源代码优化技巧、实践应用分析以及进阶开发技巧。首先概述了EVCC协议和Gridwiz代码的基础知识,随后深入探讨了Gridwiz的架构设计、设计模式的应用、代码规范以及性能优化措施。在实践应用部分,文章分析了Gridwiz在不同场景下的应用和功能模块,提供了实际案例和故障诊断的详细讨论。此外,本文还探讨了
JFFS2源代码深度探究:数据结构与算法解析

# 摘要
JFFS2是一种广泛使用的闪存文件系统,设计用于嵌入式设备和固态存储。本文首先概述了JFFS2文件系统的基本概念和特点,然后深入分析其数据结构、关键算法、性能优化技术,并结合实际应用案例进行探讨。文中详细解读了JFFS2的节点类型、物理空间管理以及虚拟文件系统接口,阐述了其压
资源上传下载、课程学习等过程中有任何疑问或建议,欢迎提出宝贵意见哦~我们会及时处理!
点击此处反馈


专栏目录
最低0.47元/天 解锁专栏
买1年送3月
百万级
高质量VIP文章无限畅学
千万级
优质资源任意下载
C知道
免费提问 ( 生成式Al产品 )