图论优化神器:Max-Min算法在图结构中的应用剖析
发布时间: 2024-09-10 12:13:11 阅读量: 137 订阅数: 73 

图论中最短路径求解-基于Dijkstra算法的实践与优化
# 1. 图论基础与Max-Min算法概述
图论作为数学的一个分支,长久以来在计算机科学领域扮演着重要的角色,尤其是在网络分析、路由优化和资源分配等众多应用中。Max-Min算法,作为图论中的一个高效算法,通过其在效率和精确性上的平衡,在复杂系统的优化问题中具有重要的应用价值。本章将介绍图论的基础知识,以及Max-Min算法的基本概念、应用和优势。这为后续章节深入探讨算法的实现细节、优化技巧和实际案例打下坚实基础。
# 2. 图的表示和Max-Min算法的理论基础
### 2.1 图的基本概念
#### 2.1.1 图的定义和表示方法
在计算机科学中,图是由节点(或顶点)以及连接这些节点的边组成的数学结构。图论是研究图的性质、算法和应用的数学分支,它在计算机网络、社交网络分析、交通规划等领域中有着广泛的应用。
图的表示方法主要有两种:邻接矩阵和邻接表。邻接矩阵是一种矩阵表示法,其中矩阵中的元素表示图中的边,如果顶点i和顶点j之间有边,则matrix[i][j]=1,否则为0。邻接表是一种列表表示法,每个顶点都有一个边列表,包含与该顶点相连的所有顶点。
```python
# 邻接矩阵示例
matrix = [
[0, 1, 0, 0, 1],
[1, 0, 1, 1, 1],
[0, 1, 0, 1, 0],
[0, 1, 1, 0, 1],
[1, 1, 0, 1, 0]
]
# 邻接表示例
adjacency_list = {
'A': ['B', 'E'],
'B': ['A', 'C', 'D', 'E'],
'C': ['B', 'D'],
'D': ['B', 'C', 'E'],
'E': ['A', 'B', 'D']
}
```
#### 2.1.2 图的分类及其特点
图可以根据边的有向性分为有向图和无向图,也可以根据边是否带有权重分为加权图和非加权图。有向图中的边具有方向性,而无向图中的边是双向的。加权图中的边带有数值,表示连接顶点之间的成本或距离,而非加权图中边仅表示连接关系,不带数值。
图的分类对于图的表示和算法的选择都有着重要的影响。例如,在解决最短路径问题时,Dijkstra算法适用于非负权值的加权无向图,而Floyd-Warshall算法则可以解决加权有向图中的多源最短路径问题。
### 2.2 算法的数学原理
#### 2.2.1 Max-Min算法的数学定义
Max-Min算法是一种基于图论的算法,它主要关注在图的顶点或边上找到最大值和最小值。该算法可以应用于不同的场景,例如在有向无环图(DAG)中找到最大权重路径,或者在网络流问题中找到最大流量。
算法的核心在于不断比较并更新图中顶点的值,通过迭代的方式最终找到全局的最大值和最小值。在具体实现时,需要定义一个初始状态,然后基于图中的边和顶点进行迭代更新。
#### 2.2.2 算法的理论优势和应用场景
Max-Min算法的优势在于它能够以较少的计算资源和时间复杂度找到问题的近似解。尤其是在处理大规模网络数据时,Max-Min算法提供了一种高效且实用的解决策略。
该算法的应用场景非常广泛,包括但不限于:
- 在资源分配问题中,寻找最优的资源分配方案。
- 在网络设计中,优化网络的拓扑结构,提升网络的鲁棒性。
- 在复杂系统建模中,帮助决策者在各种约束条件下制定最优策略。
### 2.3 算法的时间复杂度和空间复杂度分析
#### 2.3.1 算法复杂度的理论推导
Max-Min算法的时间复杂度分析通常基于图的表示方法和算法执行的具体步骤。在有n个顶点和m条边的图中,如果使用邻接矩阵表示,每次更新操作的时间复杂度为O(1),而迭代过程通常需要O(n^2)的时间复杂度。如果使用邻接表表示,时间复杂度则依赖于边的数量,为O(m)。
空间复杂度分析则主要考虑存储图结构和迭代过程中所需额外空间的需求。邻接矩阵表示通常需要O(n^2)的空间复杂度,而邻接表表示需要O(n+m)的空间复杂度。
#### 2.3.2 实际应用中的复杂度评估
在实际应用中,算法的复杂度评估还会受到图的稠密程度、边的权重分布、初始条件等因素的影响。例如,在处理稀疏图时,邻接表往往比邻接矩阵更节省空间。同时,算法的优化策略,如使用哈希表减少查找时间,也会影响到最终的复杂度。
通过实际的案例分析,我们可以评估算法在特定条件下的性能表现,为算法的改进提供依据。例如,在一个具有1000个顶点和2000条边的网络中,Max-Min算法可能在几次迭代内即可收敛到稳定状态,其执行时间可能在几毫秒到几十毫秒之间,显示出算法的高效性。
综上所述,本章节深入探讨了图的基本概念、Max-Min算法的数学原理以及算法复杂度的理论推导和实际应用评估,为理解后续章节中Max-Min算法的编码实现、优化策略以及应用实例打下了坚实的基础。
# 3. Max-Min算法的实现与优化
在探讨Max-Min算法的实现与优化这一章节中,我们将深入探讨算法在现实世界中的应用。本章内容将按照以下结构进行展开:
## 3.1 算法的编码实现
### 3.1.1 数据结构的选择和设计
在实现Max-Min算法时,合适的数据结构是至关重要的。通常情况下,图可以表示为邻接矩阵或邻接表。邻接矩阵适合表示稠密图,而邻接表则适合稀疏图。选择合适的数据结构能够显著影响算法的性能。
```python
class Graph:
def __init__(self, vertices):
self.V = vertices
self.graph = [[0 for column in range(vertices)]
for row in range(vertices)]
def add_edge(self, u,
```

 百万级
高质量VIP文章无限畅学
百万级
高质量VIP文章无限畅学
 千万级
优质资源任意下载
千万级
优质资源任意下载
 C知道
免费提问 ( 生成式Al产品 )
C知道
免费提问 ( 生成式Al产品 )
0
0
相关推荐

专栏简介
本专栏深入探讨了 Max-Min 算法,一种强大的数据结构算法,用于在数据结构中寻找最优路径。从基础入门到高级应用,专栏全面解析了 Max-Min 算法的原理、实现和应用场景。通过实战演练和应用案例,读者将掌握如何使用 Max-Min 算法解决现实世界中的资源分配问题。此外,专栏还深入探讨了 Max-Min 算法在选择最优策略中的应用,帮助读者理解如何利用算法制定最佳决策。无论你是数据结构新手还是经验丰富的开发者,本专栏都将为你提供宝贵的见解和实用的技能,帮助你优化数据结构并找到最优解。
专栏目录
最低0.47元/天 解锁专栏
买1年送3月
百万级
高质量VIP文章无限畅学
千万级
优质资源任意下载
C知道
免费提问 ( 生成式Al产品 )
最新推荐
深度解析EDA软件:算法优化让你的设计飞起来

# 摘要
本文全面概述了EDA(电子设计自动化)软件及其在现代电子设计中的核心作用。首先介绍了EDA软件的定义、发展历程和主要分类,然后深入探讨了算法优化的理论背景和实践应用,包括算法复杂度分析、设计策略及优化方法论。接着,文章分析了布局布线、逻辑综合和设计验证优化的实际案例,并讨论了算法优化的高级技巧,如机器学习、多核并行计算和硬件加速技术。通过对EDA软件性能评估指标的分析,本
【管理与监控】:5个关键步骤确保Polycom Trio系统最佳性能

# 摘要
本文全面介绍了Polycom Trio系统的架构、性能评估、配置优化、监控与故障诊断、扩展性实践案例以及持续性能管理。通过对Polycom Trio系统组件和性能指标的深入分析,本文阐述了如何实现系统优化和高效配置。文中详细讨论了监控工具的选择、日志管理策略以及维护检查流程,旨在通过有效的故障诊断和预防性维护来提升系统的稳定性和可靠性。
电力半导体器件选型指南:如何为电力电子项目挑选最佳组件
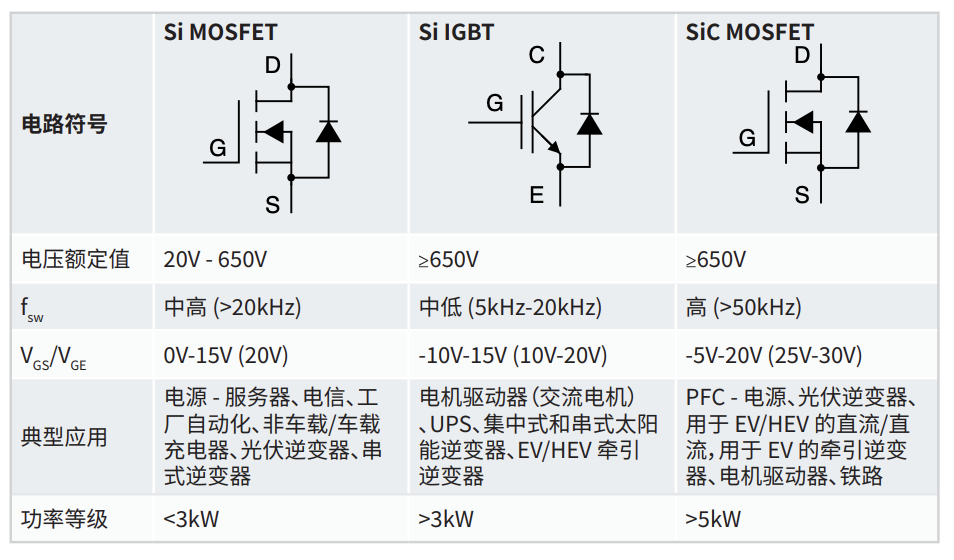
# 摘要
本文全面概述了电力半导体器件的基础知识、技术参数、选型实践考量以及测试与验证流程。在技术参数方面,文章详细介绍了器件的电气特性、热性能和可靠性指标,为电力系统工程师提供了选型时的决策依据。选型实践部分则侧重于应用场景分析、成本效益评估和未来发展考量,旨在指导工程师们在实际工程中做出既经济又可靠的选择。此外,本文还
【mike11建筑模拟全攻略】:从入门到高级应用的全方位教程
# 摘要
本文全面介绍了mike11建筑模拟软件的各个方面,从基础操作到高级技巧,为建筑模拟提供了一个系统的指导。首先,文章对mike11软件的界面布局、基本设置和视图渲染等基础操作进行了详细介绍。接着,深入探讨了建筑模拟理论基础,包括模拟的目的、建筑物理基础以及模拟流程和参数设置。进阶技巧章节则着重于高级建模技术、环境与气候模拟以及能效与
斯坦福教材揭秘:凸优化理论到实践的快速跨越
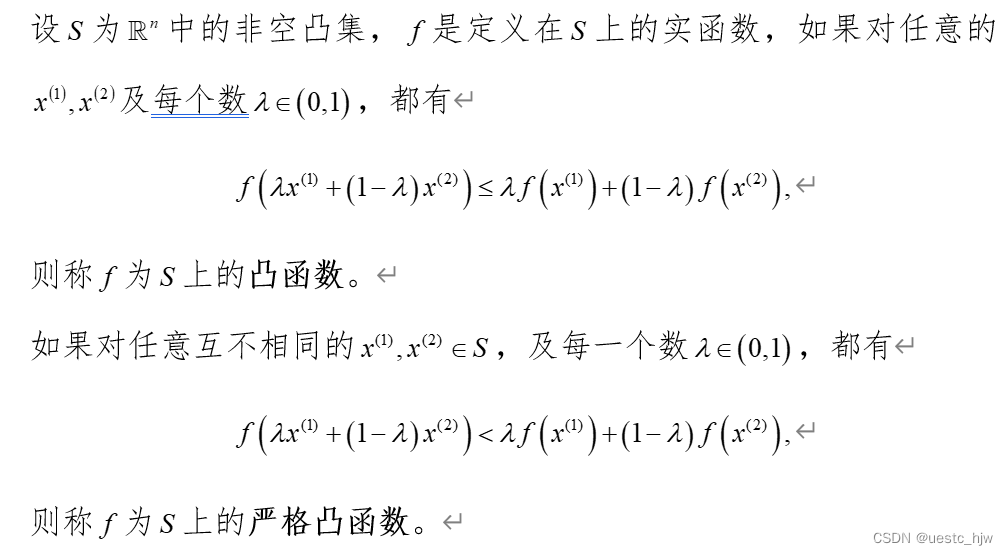
# 摘要
本论文系统地介绍了凸优化的基本概念、数学基础、理论框架,以及在工程和科研中的应用案例。首先,文章概述了凸优化的基础知识和数学基础,并详细解析了线性规划、二次规划和对偶理论等关键理论。接着,文章探讨了凸优化工具的使用和环境搭建,强调了模型建立与简化的重要性。随后,通过机器学习、信号处理、运筹学和控制系统等多个领域的应用案例,展示了凸优化技术的实用性。最后,论文展望了凸优化领域的发展趋势,讨论
【tc itch扩展性】:拉伸参数在二次开发中的角色与挑战,稀缺的深入探讨
# 摘要
本文对tcsh shell环境中的参数扩展技术进行了全面的探讨和分析。从参数扩展的基本概念、规则、类别及模式匹配等理论基础出发,深入解析了其在脚本编写、调试优化以及第三方工具集成中的具体应用。文章还着重介绍了复杂参数处理、函数编程中的应用技巧,以及在错误处理中的重要作用。针对二次开发中的挑战,提出了相应的策略和解决方案,并通过案例研究具体分析了参数扩展在特
【网络延迟优化】:揭秘原因并提供实战优化策略

# 摘要
网络延迟是影响数据传输效率和用户体验的关键因素,尤其是在实时性和高要求的网络应用中。本文深入探讨了网络延迟的定义、产生原因、测量方法以及优化策略。从网络结构、设备性能、协议配置到应用层因素,本文详细分析了导致网络延迟的多方面原因。在此基础上,文章提出了一系列实战策略和案例研究,涵盖网络设备升级、协议调整和应用层面的优化,旨在减少延迟和提升网络性能。最后,本文展望了未来技术,如软件定义网络
资源上传下载、课程学习等过程中有任何疑问或建议,欢迎提出宝贵意见哦~我们会及时处理!
点击此处反馈


专栏目录
最低0.47元/天 解锁专栏
买1年送3月
百万级
高质量VIP文章无限畅学
千万级
优质资源任意下载
C知道
免费提问 ( 生成式Al产品 )