线条动画与其他动画技术的比较:优势与劣势分析,做出明智选择
发布时间: 2024-07-11 11:05:50 阅读量: 96 订阅数: 29 

几种RFID支付技术的比较与分析

# 1. 线条动画与其他动画技术的概述
线条动画是一种独特的动画形式,它使用线条来创建图像,并通过移动这些线条来产生动画效果。与其他动画技术相比,线条动画具有其独特的优势和劣势。
线条动画的优势在于其表现力强,能够通过简单线条勾勒出复杂的情感和动作。同时,线条动画具有极高的灵活性和可控性,动画师可以轻松地调整线条的形状和运动,从而实现各种不同的效果。
# 2. 线条动画的优势和劣势
### 2.1 线条动画的独特优势
#### 2.1.1 表现力强
线条动画以其独特的表现力而著称。它能够通过简单的线条勾勒出复杂的情感和动作,传达出微妙的含义和丰富的内涵。
#### 2.1.2 灵活性和可控性
线条动画具有极高的灵活性,可以自由地塑造和改变角色和场景。动画师可以轻松地调整线条的粗细、形状和运动,从而创造出各种各样的视觉效果。
### 2.2 线条动画的局限性
#### 2.2.1 制作周期长
线条动画的制作过程通常非常耗时,需要逐帧绘制每一幅画面。这使得线条动画的制作周期往往比其他动画技术更长。
#### 2.2.2 视觉效果受限
虽然线条动画具有独特的艺术性,但它的视觉效果也受到一定的限制。与计算机图形动画(CGI)等技术相比,线条动画在表现逼真度和复杂场景方面存在一定的局限性。
**代码块:**
```python
def draw_line(x1, y1, x2, y2):
"""
绘制一条线段。
参数:
x1, y1: 线段起点的坐标。
x2, y2: 线段终点的坐标。
"""
# 计算线段的长度。
length = math.sqrt((x2 - x1)**2 + (y2 - y1)**2)
# 计算线段的单位向量。
unit_vector = (x2 - x1) / length, (y2 - y1) / length
# 逐像素绘制线段。
for i in range(int(length)):
x = x1 + i * unit_vector[0]
y = y1 + i * unit_vector[1]
set_pixel(x, y)
```
**逻辑分析:**
这段代码定义了一个名为 `draw_line` 的函数,用于绘制一条线段。它接受四个参数:线段起点的坐标 `(x1, y1)` 和线段终点的坐标 `(x2, y2)`。
函数首先计算线段的长度,然后计算线段的单位向量。单位向量是一个长度为 1 的向量,其方向与线段的方向相同。
接下来,函数逐像素绘制线段。它从线段

 百万级
高质量VIP文章无限畅学
百万级
高质量VIP文章无限畅学
 千万级
优质资源任意下载
千万级
优质资源任意下载
 C知道
免费提问 ( 生成式Al产品 )
C知道
免费提问 ( 生成式Al产品 )
0
0
相关推荐

专栏简介
“线条动画”专栏深入探讨了线条动画背后的技术奥秘,揭示了其流畅视觉体验的秘密。专栏涵盖了广泛的主题,包括优化技巧、常见问题诊断、算法探索、不同领域应用、人工智能和云计算赋能、大数据分析、物联网交互、增强现实融合、移动端和 Web 开发、游戏开发、医疗可视化等。通过这些文章,读者可以了解线条动画的原理、优化方法、创新应用和未来趋势,从而提升动画制作效率,打造极致的动画体验。
专栏目录
最低0.47元/天 解锁专栏
买1年送3月
百万级
高质量VIP文章无限畅学
千万级
优质资源任意下载
C知道
免费提问 ( 生成式Al产品 )
最新推荐
AMESim液压仿真秘籍:专家级技巧助你从基础飞跃至顶尖水平

# 摘要
AMESim液压仿真软件是工程师们进行液压系统设计与分析的强大工具,它通过图形化界面简化了模型建立和仿真的流程。本文旨在为用户提供AMESim软件的全面介绍,从基础操作到高级技巧,再到项目实践案例分析,并对未来技术发展趋势进行展望。文中详细说明了AMESim的安装、界面熟悉、基础和高级液压模型的建立,以及如何运行、分析和验证仿真结果。通过探索自定义组件开发、多学科仿真集成以及高级仿真算法的应用,本文
【高频领域挑战】:VCO设计在微波工程中的突破与机遇
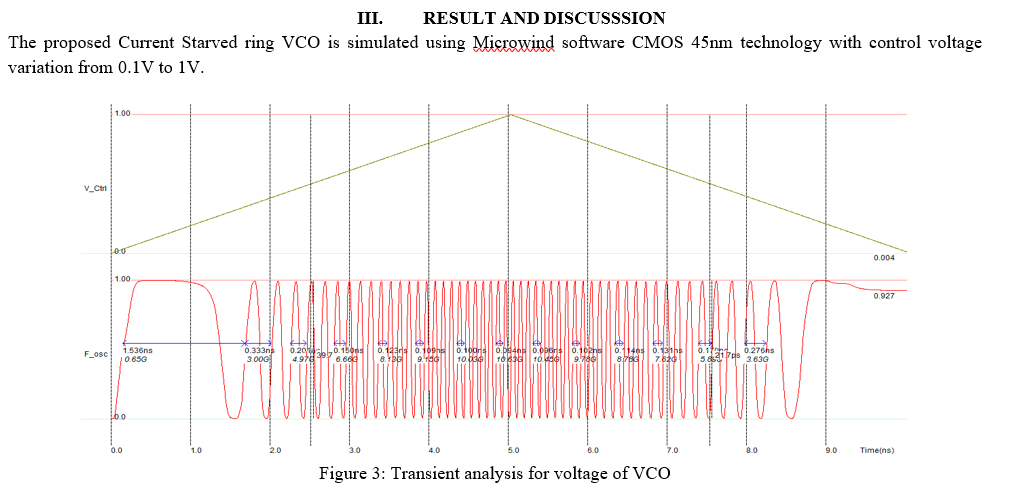
# 摘要
本论文深入探讨了压控振荡器(VCO)的基础理论与核心设计原则,并在微波工程的应用技术中展开详细讨论。通过对VCO工作原理、关键性能指标以及在微波通信系统中的作用进行分析,本文揭示了VCO设计面临的主要挑战,并提出了相应的技术对策,包括频率稳定性提升和噪声性能优化的方法。此外,论文还探讨了VCO设计的实践方法、案例分析和故障诊断策略,最后对VCO设计的创新思路、新技术趋势及未来发展挑战
实现SUN2000数据采集:MODBUS编程实践,数据掌控不二法门
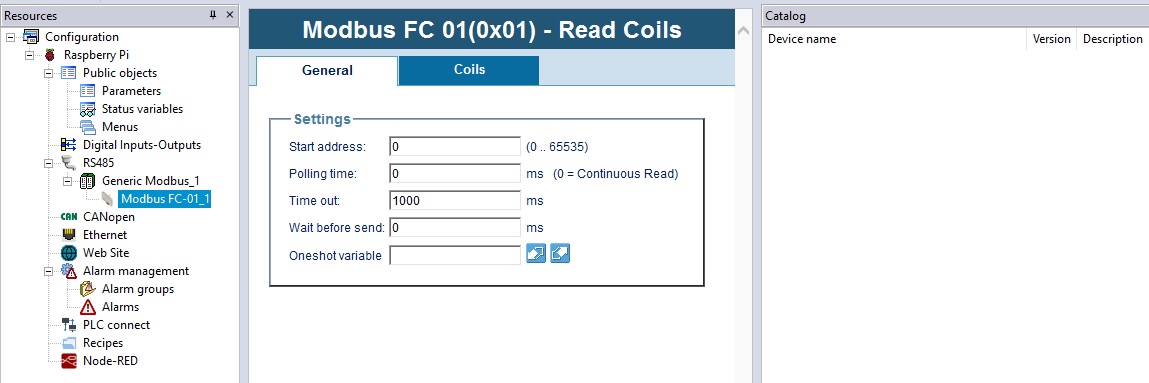
# 摘要
本文系统地介绍了MODBUS协议及其在数据采集中的应用。首先,概述了MODBUS协议的基本原理和数据采集的基础知识。随后,详细解析了MODBUS协议的工作原理、地址和数据模型以及通讯模式,包括RTU和ASCII模式的特性及应用。紧接着,通过Python语言的MODBUS库,展示了MODBUS数据读取和写入的编程实践,提供了具体的实现方法和异常管理策略。本文还结合SUN20
【性能调优秘籍】:深度解析sco506系统安装后的优化策略
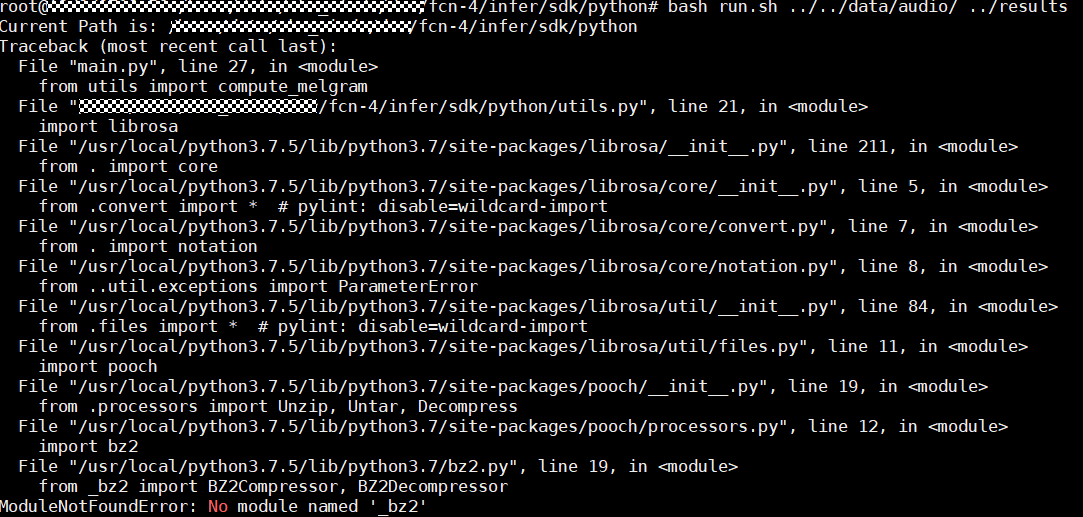
# 摘要
本文对sco506系统的性能调优进行了全面的介绍,首先概述了性能调优的基本概念,并对sco506系统的核心组件进行了介绍。深入探讨了核心参数调整、磁盘I/O、网络性能调优等关键性能领域。此外,本文还揭示了高级性能调优技巧,包括CPU资源和内存管理,以及文件系统性能的调整。为确保系统的安全性能,文章详细讨论了安全策略、防火墙与入侵检测系统的配置,以及系统审计与日志管理的优化。最后,本文提供了系统监控与维护的
网络延迟不再难题:实验二中常见问题的快速解决之道
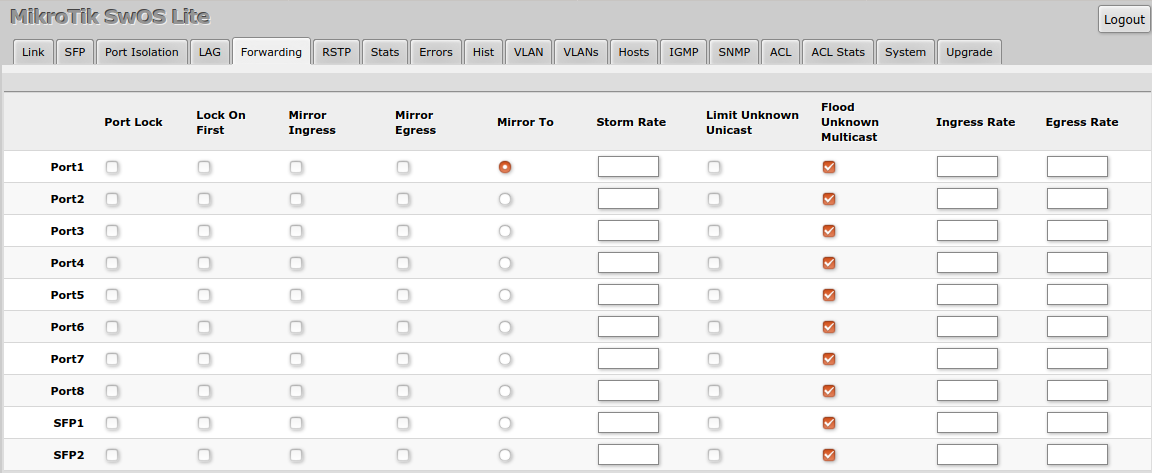
# 摘要
网络延迟是影响网络性能的重要因素,其成因复杂,涉及网络架构、传输协议、硬件设备等多个方面。本文系统分析了网络延迟的成因及其对网络通信的影响,并探讨了网络延迟的测量、监控与优化策略。通过对不同测量工具和监控方法的比较,提出了针对性的网络架构优化方案,包括硬件升级、协议配置调整和资源动态管理等。
期末考试必备:移动互联网商业模式与用户体验设计精讲

# 摘要
移动互联网的迅速发展带动了商业模式的创新,同时用户体验设计的重要性日益凸显。本文首先概述了移动互联网商业模式的基本概念,接着深入探讨用户体验设计的基础,包括用户体验的定义、重要性、用户研究方法和交互设计原则。文章重点分析了移动应用的交互设计和视觉设计原则,并提供了设计实践案例。之后,文章转向移动商业模式的构建与创新,探讨了商业模式框架
【多语言环境编码实践】:在各种语言环境下正确处理UTF-8与GB2312
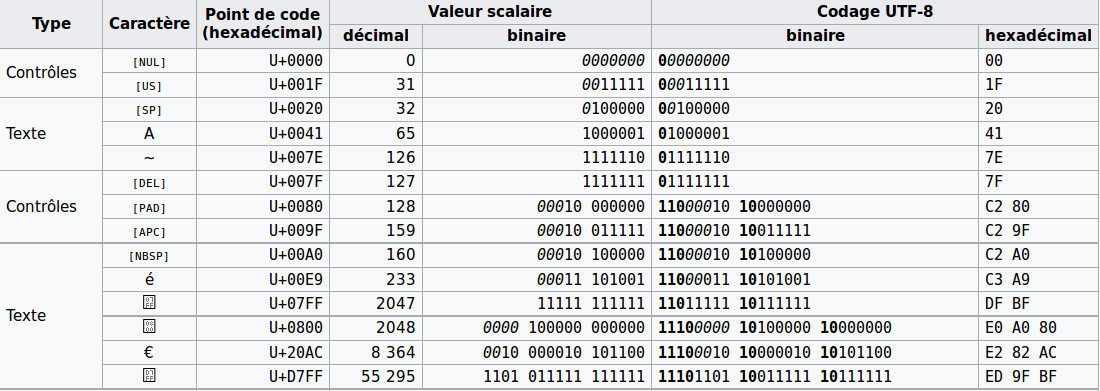
# 摘要
随着全球化的推进和互联网技术的发展,多语言环境下的编码问题变得日益重要。本文首先概述了编码基础与字符集,随后深入探讨了多语言环境所面临的编码挑战,包括字符编码的重要性、编码选择的考量以及编码转换的原则和方法。在此基础上,文章详细介绍了UTF-8和GB2312编码机制,并对两者进行了比较分析。此外,本文还分享了在不同编程语言中处理编码的实践技巧,
【数据库在人事管理系统中的应用】:理论与实践:专业解析
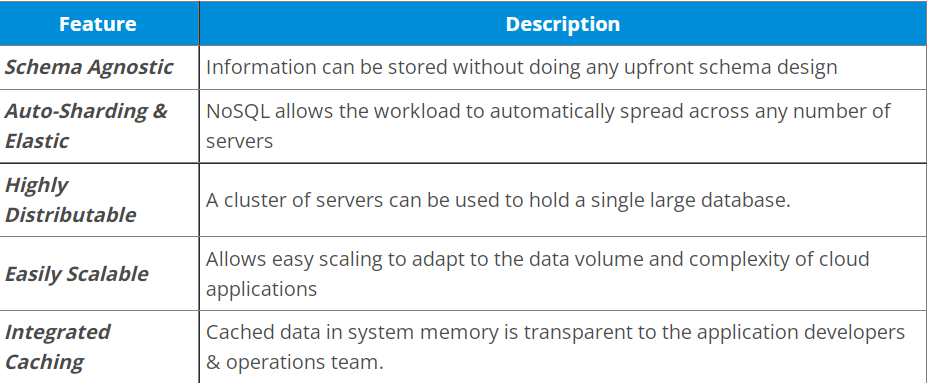
# 摘要
本文探讨了人事管理系统与数据库的紧密关系,分析了数据库设计的基础理论、规范化过程以及性能优化的实践策略。文中详细阐述了人事管理系统的数据库实现,包括表设计、视图、存储过程、触发器和事务处理机制。同时,本研究着重讨论了数据库的安全性问题,提出认证、授权、加密和备份等关键安全策略,以及维护和故障处理的最佳实践。最后,文章展望了人事管理系统的发展趋
【Docker MySQL故障诊断】:三步解决权限被拒难题
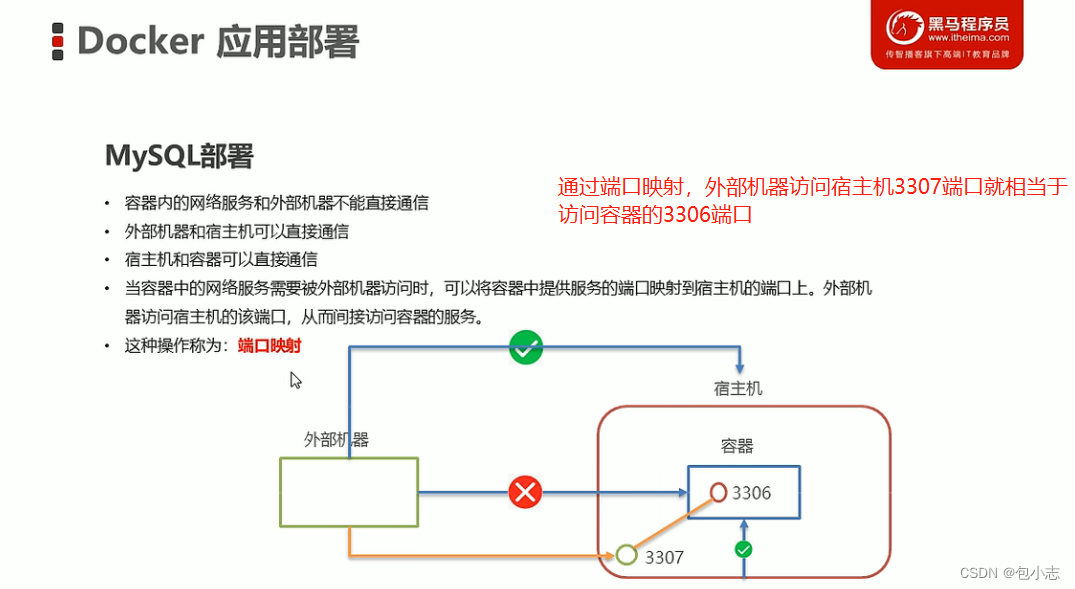
# 摘要
随着容器化技术的广泛应用,Docker已成为管理MySQL数据库的流行方式。本文旨在对Docker环境下MySQL权限问题进行系统的故障诊断概述,阐述了MySQL权限模型的基础理论和在Docker环境下的特殊性。通过理论与实践相结合,提出了诊断权限问题的流程和常见原因分析。本文还详细介绍了如何利用日志文件、配置检查以及命令行工具进行故障定位与修复,并探讨了权限被拒问题的解决策略和预防措施
资源上传下载、课程学习等过程中有任何疑问或建议,欢迎提出宝贵意见哦~我们会及时处理!
点击此处反馈


专栏目录
最低0.47元/天 解锁专栏
买1年送3月
百万级
高质量VIP文章无限畅学
千万级
优质资源任意下载
C知道
免费提问 ( 生成式Al产品 )