OpenCV图像裁剪与图像增强:提升图像质量的利器
发布时间: 2024-08-09 15:09:02 阅读量: 36 订阅数: 27 

opencv_python-4.2.0-cp37-cp37m-win_amd64的whl文件.zip
# 1. OpenCV图像裁剪基础
图像裁剪是计算机视觉中一项基本操作,用于从图像中提取感兴趣区域。OpenCV提供了一系列函数来执行图像裁剪,满足各种需求。本章将介绍OpenCV图像裁剪的基础知识,包括:
- 图像裁剪的概念和目的
- OpenCV中用于图像裁剪的函数
- 图像裁剪的常见应用场景
# 2. OpenCV图像裁剪实战
### 2.1 基本图像裁剪
基本图像裁剪是最简单的裁剪操作,它允许从图像中提取一个矩形区域。OpenCV提供了`cv2.crop()`函数来执行此操作。
```python
import cv2
# 读取图像
image = cv2.imread('image.jpg')
# 指定裁剪区域
x, y, w, h = 100, 100, 200, 200
# 裁剪图像
cropped_image = image[y:y+h, x:x+w]
# 显示裁剪后的图像
cv2.imshow('Cropped Image', cropped_image)
cv2.waitKey(0)
cv2.destroyAllWindows()
```
**逻辑分析:**
* `cv2.imread()`函数读取图像并将其存储在`image`变量中。
* `x, y, w, h`变量指定裁剪区域的左上角坐标和宽度和高度。
* `image[y:y+h, x:x+w]`语法从`image`中提取指定区域。
* `cv2.imshow()`函数显示裁剪后的图像。
### 2.2 高级图像裁剪
高级图像裁剪技术允许从图像中提取更复杂的形状。OpenCV提供了多种方法来实现此目的。
#### 2.2.1 基于ROI(感兴趣区域)的裁剪
基于ROI的裁剪允许从图像中提取任意形状的区域。ROI由一组多边形顶点定义。
```python
import cv2
# 读取图像
image = cv2.imread('image.jpg')
# 定义ROI顶点
pts = np.array([[100, 100], [200, 100], [200, 200], [100, 200]])
# 创建掩码
mask = np.zeros(image.shape[:2], np.uint8)
cv2.fillPoly(mask, [pts], 255)
# 应用掩码
masked_image = cv2.bitwise_and(image, image, mask=mask)
# 显示裁剪后的图像
cv2.imshow('Cropped Image', masked_image)
cv2.waitKey(0)
cv2.destroyAllWindows()
```
**逻辑分析:**
* `pts`变量定义ROI顶点。
* `cv2.fillPoly()`函数使用顶点创建掩码。
* `cv2.bitwise_and()`函数将掩码应用于图像以提取ROI。
#### 2.2.2 基于掩码的裁剪
基于掩码的裁剪允许从图像中提取具有特定像素值的区域。掩码是一个二进制图像,其中白色像素表示要保留的区域,黑色像素表示要删除的区域。
```python
import cv2
# 读取图像
image = cv2.imread('image.jpg')
# 创建掩码
mask = np.zeros(image.shape[:2], np.uint8)
mask[100:200, 100:200] = 255
# 应用掩码
masked_image = cv2.bitwise_and(image, image, mask=mask)
# 显示裁剪后的图像
cv2.imshow('Cropped Image', masked_image)
cv2.waitKey(0)
cv2.destroyAllWindows()
```
**逻辑分析:**
* `mask`变量创建掩码,其中`[100:200, 100:200]`区域为白色。
* `cv2.bitwise_and()`函数将掩码应用于图像以提取白色区域。
#### 2.2.3 基于轮廓的裁剪
基于轮廓的裁剪允许从图像中提取对象。轮廓是一组连接的像素,它们定义了对象的边界。
```python
import cv2
# 读取图像
image = cv2.imread('image.jpg')
# 转换为灰度
gray = cv2.cvtColor(image, cv2.COLOR_BGR2GRAY)
# 二值化
thresh = cv2.threshold(gray, 127, 255, cv2.THRESH_BINARY)[1]
# 查找轮廓
cnts = cv2.findContours(thresh, cv2.RETR_EXTERNAL, cv2.CHAIN_APPROX_SIMPLE)
cnts = cnts[0] if len(cnts) == 2 else cnts[1]
# 绘制轮廓
cv2.drawContours(image, cnts, -1, (0, 255, 0), 2)
# 显示图像
cv2.imshow('Contours', image)
cv2.waitKey(0)
cv2.destroyAllWindows()
```
**逻辑分析:**
* `cv2.cvtColor()`函数将图像转换为灰度。
* `cv2.threshold()`函数将灰度图像二值化。
* `cv2.findContours()`函数查找图像中的轮廓。
* `cv2.drawContours()`函数在图像上绘制轮廓。
# 3.2 图像增强算法
在图像增强基础中,我们了解了图像增强的重要性以及常用的增强技术。在这一节中,我们将深入探究一些常用的图像增强算法,包括直方图均衡化、对比度增强和锐化。
#### 3.2.1

 百万级
高质量VIP文章无限畅学
百万级
高质量VIP文章无限畅学
 千万级
优质资源任意下载
千万级
优质资源任意下载
 C知道
免费提问 ( 生成式Al产品 )
C知道
免费提问 ( 生成式Al产品 )
0
0
相关推荐

专栏简介
《OpenCV图像裁剪全攻略》专栏是一份全面的指南,涵盖了使用OpenCV进行图像裁剪的各个方面。从入门基础到高级技巧,该专栏提供了深入的见解和实际案例,帮助读者掌握图像裁剪的艺术。专栏探讨了裁剪机制、性能优化、变形、难题解决、机器学习集成、计算机视觉应用、图像分割、图像增强、图像融合、图像配准、图像识别、图像生成、图像修复、图像分析、图像压缩和图像传输等主题。通过结合理论解释和实际示例,该专栏为图像处理人员、计算机视觉工程师和机器学习从业者提供了宝贵的资源,帮助他们解锁图像裁剪的无限可能,提升图像处理效率和效果。
专栏目录
最低0.47元/天 解锁专栏
买1年送3月
百万级
高质量VIP文章无限畅学
千万级
优质资源任意下载
C知道
免费提问 ( 生成式Al产品 )
最新推荐
Quectel L76K模块深度解析:掌握技术亮点与选购秘诀
# 摘要
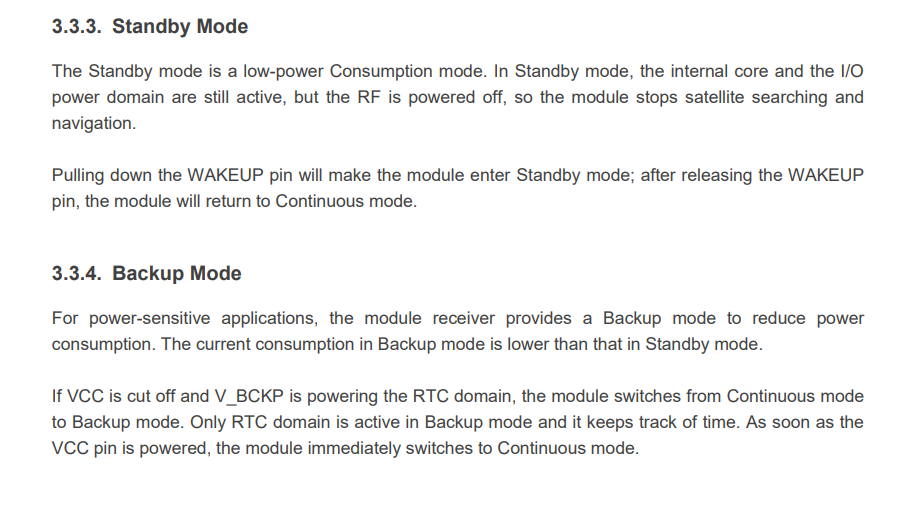
本文详细介绍了Quectel L76K GNSS模块的技术细节和应用案例。首先,文章概览了L76K模块的技术原理,包括其高精度定位技术、低功耗设计以及硬件架构。接着,文章探讨了L76K模块在物联网(IoT)、汽车行业和消费电子等领域的应用案例,着重分析了模块在智能追踪、车辆监控、智能设备等实际环境中的集成和效益。
任务管理不再难:FreeRTOS任务创建、调度与同步的终极指南

# 摘要
FreeRTOS作为一个流行的实时操作系统,以其轻量级和高效率著称,广泛应用于嵌入式系统中。本文首先概述了FreeRTOS的核心概念,随后深入探讨了任务创建、任务调度、任务同步与通信等方面的原理与应用。文章详细介绍了任务创建时的理论基础
【智能电能表操作手册】:12个实用技巧助你快速上手
# 摘要
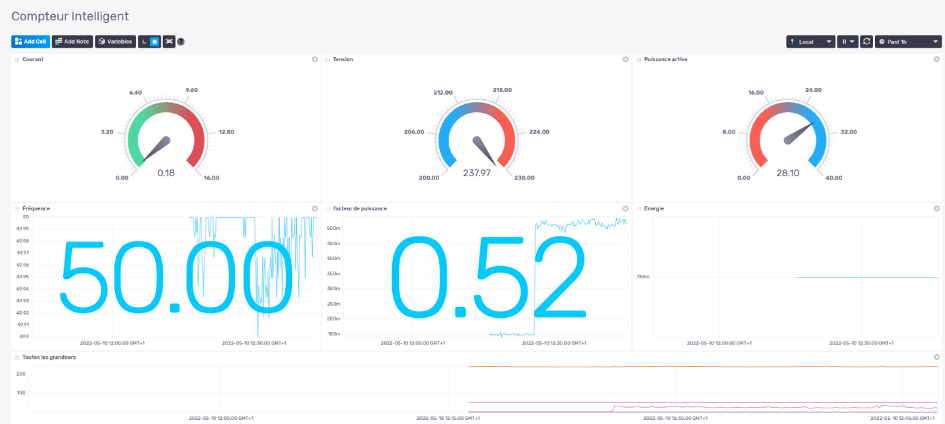
智能电能表作为智能电网的关键组成部分,具备精确计量、远程读取和数据分析等多项功能。本文首先概述了智能电能表的基本概念,随后详细介绍了其安装、配置、日常操作、功能拓展以及高级应用案例。在安装与配置章节中,讨论了安装前的准备、具体安装步骤和配置方法。日常操作章节则聚焦于读数方法、维护与故障排除以及升级与优化策略。功能拓展章节着重于数据分析、联动控制应用和
【NAFNet图像去模糊实战手册】:代码下载与运行细节全解析

# 摘要
NAFNet模型是一种先进的图像去模糊技术,它通过特定的网络架构和算法原理实现高质量的图像复原。本文首先介绍了NAFNet模型的概述和图像去模糊的背景知识,然后深入解析了该模型的核心理论、算法原理,以及关键技术点。文章进一步详细阐述了如何
【NeRF-SLAM代码解密】:深入剖析系统框架与核心原理

# 摘要
NeRF-SLAM技术作为结合神经辐射场(NeRF)和同步定位与地图构建(SLAM)的新兴领域,为三维场景重建和机器人导航提供了新的解决方案。本文首先概述了NeRF-SLAM的技术框架,随后详细解析了系统架构设计,以及其关键算法与技术原理。通过探索NeRF模型的数学基础和SLAM中关键
【C#日期时间转换优化】:避开陷阱,提升代码清晰度
# 摘要
C#作为一种流行的编程语言,其日期时间转换功能对于软件开发至关重要。本文系统地介绍了C#中日期时间转换的基础知识,探讨了在实际编程中可能遇到的常见问题及其陷阱,比如时区错误、格式化错误以及Unix时间戳陷阱等。针对这些问题,本文提出了一系列优化策略,包括提高代码清晰度和转换效率的方法。此外,本文还分享了C#日期时间转换在实践应用中的经验和高级技巧,如利用Noda Time库和Roslyn工具的优化实践。通过这些策略和技巧的应用,可以显著提升开发效率和代码的可维护性。
# 关键字
C#编程;日期时间转换;代码清晰度;转换效率;Noda Time;Roslyn代码分析
参考资源链接:
【Tomcat根目录配置宝典】:解决路径问题,实现高效部署

# 摘要
本文详细介绍了Apache Tomcat服务器的根目录结构及其作用,并探讨了在此基础上如何解决路径问题、实现高效部署以及应用高级配置。通过对标准目录结构、应用部署机制、日志和资源管理的分析,文章揭示了Tomcat根目录中各关键目录的功能及其对服务器配置的影响。文章进一步提出了路径问题的分类、分析及解决方法,并给
【系统分析师进阶课程】:单头线号检测机制详解

# 摘要
单头线号检测机制是提高工业自动化和智能监控系统精度的重要技术。本文首先概述了单头线号检测的基本概念和理论基础,包括其定义、原理、关键技术以及应用场景和优势。随后,文章深入分析了该检测机制在实践应用中的系统设计、实现、测试验证以及面对问题时的解决方案。进而探讨了单头线号检测的优化改进策略、与其他技术的结合方式,以及未来发展的趋势和前景。最后,通过具体的案例分析,本文进一步
TIMESAT性能调优大揭秘:系统提速的秘密武器
# 摘要
TIMESAT是一种先进的性能监控和优化工具,本文全面介绍了TIMESAT的基本配置、性能监控功能、性能调优实践以及高级性能分析与优化方法。通过详细的章节划分,本文首先概述了TIMESAT的简介和基础配置要点,随后深入探讨了其性能监控工具的安装、配置和性能指标解读,并展示了如何进行实时性能数据分析。紧接着,文章着重于系统级和应用级的性能调优策略,以及硬件资源管理技巧。在高级性能分析与优
资源上传下载、课程学习等过程中有任何疑问或建议,欢迎提出宝贵意见哦~我们会及时处理!
点击此处反馈


专栏目录
最低0.47元/天 解锁专栏
买1年送3月
百万级
高质量VIP文章无限畅学
千万级
优质资源任意下载
C知道
免费提问 ( 生成式Al产品 )