OpenCV轮廓提取与机器人视觉:赋能智能机器人,让机器人看得更清楚
发布时间: 2024-08-09 11:19:59 阅读量: 27 订阅数: 35 

机器人视觉系统:技术原理与实践应用

# 1. OpenCV轮廓提取基础
OpenCV轮廓提取是一种计算机视觉技术,用于从图像中提取物体或区域的边界。它在各种应用中至关重要,例如物体识别、手势识别和缺陷检测。
轮廓是图像中具有相似颜色或亮度值的像素集合的边界。OpenCV提供了多种算法来检测和提取图像中的轮廓,包括边缘检测和轮廓查找。边缘检测算法识别图像中的边缘,而轮廓查找算法将这些边缘连接起来以形成轮廓。
轮廓提取是图像处理中的一项基本任务,它为后续分析和处理提供了基础。通过提取轮廓,我们可以确定物体的形状、大小和位置,从而为进一步的计算机视觉任务提供有价值的信息。
# 2. OpenCV轮廓提取算法
### 2.1 边缘检测算法
边缘检测是图像处理中的一项基本技术,用于检测图像中像素之间的不连续性,从而提取图像中的轮廓。OpenCV提供了多种边缘检测算法,其中最常用的两种是Canny边缘检测和Sobel边缘检测。
#### 2.1.1 Canny边缘检测
Canny边缘检测算法是一种多阶段边缘检测算法,它通过以下步骤来检测图像中的边缘:
1. **降噪:**使用高斯滤波器对图像进行降噪,以消除图像中的噪声。
2. **计算梯度:**使用Sobel算子计算图像中每个像素的梯度幅值和梯度方向。
3. **非极大值抑制:**沿梯度方向对梯度幅值进行非极大值抑制,以去除非边缘像素。
4. **滞后阈值化:**使用两个阈值(高阈值和低阈值)对梯度幅值进行滞后阈值化,以检测强边缘和弱边缘。
5. **连接边缘:**使用滞后阈值化产生的弱边缘连接强边缘,以形成完整的边缘。
**代码示例:**
```python
import cv2
import numpy as np
# 读取图像
image = cv2.imread('image.jpg')
# 转换为灰度图像
gray = cv2.cvtColor(image, cv2.COLOR_BGR2GRAY)
# 应用 Canny 边缘检测
edges = cv2.Canny(gray, 100, 200)
# 显示结果
cv2.imshow('Canny Edges', edges)
cv2.waitKey(0)
cv2.destroyAllWindows()
```
**逻辑分析:**
* `cv2.Canny(gray, 100, 200)`:使用Canny边缘检测算法检测图像中的边缘,其中100和200分别为低阈值和高阈值。
* `cv2.imshow('Canny Edges', edges)`:显示检测到的边缘图像。
* `cv2.waitKey(0)`:等待用户按任意键继续。
* `cv2.destroyAllWindows()`:销毁所有打开的窗口。
#### 2.1.2 Sobel边缘检测
Sobel边缘检测算法是一种一阶微分边缘检测算法,它使用以下公式计算图像中每个像素的梯度:
```
Gx = ∂I/∂x = [-1, 0, 1] * I
Gy = ∂I/∂y = [-1, 0, 1]' * I
```
其中,`I`是图像,`Gx`和`Gy`分别是图像在x方向和y方向上的梯度。
**代码示例:**
```python
import cv2
import numpy as np
# 读取图像
image = cv2.imread('image.jpg')
# 转换为灰度图像
gray = cv2.cvtColor(image, cv2.COLOR_BGR2GRAY)
# 应用 Sobel 边缘检测
sobelx = cv2.Sobel(gray, cv2.CV_64F, 1, 0, ksize=5)
sobely = cv2.Sobel(gray, cv2.CV_64F, 0, 1, ksize=5)
# 计算梯度幅值
edges = np.sqrt(sobelx**2 + sobely**2)
# 归一化梯度幅值
edges = edges / np.max(edges)
# 显示结果
cv2.imshow('Sobel Edges', edges)
cv2.waitKey(0)
cv2.destroyAllWindows()
```
**逻辑分析:**
* `cv2.Sobel(gray, cv2.CV_64F, 1, 0, ksize=5)`:使用Sobel算子在x方向上计算图像的梯度,其中`ksize=5`表示使用5x5的Sobel算子。
* `cv2.Sobel(gray, cv2.CV_64F, 0, 1, ksize=5)`:使用Sobel算子在y方向上计算图像的梯度。
* `np.sqrt(sobelx**2 + sobely**2)`:计算梯度幅值。
* `edges = edges / np.max(edges)`:归一化梯度幅值,使其范围为[0, 1]。
* `cv2.imshow('Sobel Edges', edges)`:显示检测到的边缘图像。
* `cv2.waitKey(0)`:等待用户按任意键继续。
* `cv2.destroyAllWindows()`:销毁所有打开的窗口。
# 3. OpenCV轮廓提取实践应用
### 3.1 物体识别和跟踪
#### 3.1.1 目标跟踪算法
**卡尔曼滤波**
卡尔曼滤波是一种预测和更新的递归算法,广泛用于目标跟踪。它使用预测模型和测量值来估计目标的状态。
**代码块:**
```python
import cv2
import numpy as np
# 定义状态转移矩阵
A = np.array([[1, 0, 1, 0], [0, 1, 0, 1], [0, 0, 1, 0], [0, 0, 0, 1]])
# 定义测量矩阵
H = np.array([[1, 0, 0, 0], [0, 1, 0, 0]])
# 初始化卡尔曼滤波器
kf = cv2.KalmanFilter(4, 2, 0)
kf.transitionMatrix = A
kf.measurementMatrix = H
# 预测和更新目标状态
while True:
# 读取帧
frame = cv2.imread('frame.jpg')
# 检测目标
bbox = detect_object(frame)
# 预测目标状态
kf.predict()
# 更新目标状态
kf.correct(bbox)
# 显示目标跟踪结果
cv2.rectangle(frame, (bbox[0], bbox[1]), (bbox[2], bbox[3]), (0, 255, 0), 2)
cv2.imshow('Frame', frame)
# 按下 ESC 键退出
if cv2.waitKey(1) & 0xFF == 27:
break
```
**逻辑分析:**
* 状态转移矩阵 `A` 表示目标状态从上一帧到当前帧的转换关系。
* 测量矩阵 `H` 表示目标状态与测量值(边界框)之间的关系。
*

 百万级
高质量VIP文章无限畅学
百万级
高质量VIP文章无限畅学
 千万级
优质资源任意下载
千万级
优质资源任意下载
 C知道
免费提问 ( 生成式Al产品 )
C知道
免费提问 ( 生成式Al产品 )
0
0
相关推荐

专栏简介
OpenCV轮廓提取专栏是一份全面的指南,旨在帮助您从图像中提取物体形状。它涵盖了从基础知识到高级技术的各个方面,包括Canny边缘检测、轮廓查找算法、优化技巧、图像分割、目标识别、计算机视觉、深度学习、医学图像处理、工业检测、机器人视觉、人脸识别、交通监控、安防监控、无人驾驶、遥感图像处理和目标跟踪。无论您是初学者还是专家,本专栏都会为您提供宝贵的见解和实用技巧,帮助您充分利用OpenCV轮廓提取功能,解锁图像理解和计算机视觉的强大潜力。
专栏目录
最低0.47元/天 解锁专栏
买1年送3月
百万级
高质量VIP文章无限畅学
千万级
优质资源任意下载
C知道
免费提问 ( 生成式Al产品 )
最新推荐
【Putty与SSH代理】:掌握身份验证问题的处理艺术
# 摘要
随着网络技术的发展,Putty与SSH代理已成为远程安全连接的重要工具。本文从Putty与SSH代理的简介开始,深入探讨了SSH代理的工作原理与配置,包括身份验证机制和高级配置技巧。文章还详细分析了身份验证问题的诊断与解决方法,讨论了密钥管理、安全强化措施以及无密码SSH登录的实现。在高级应用方面,探讨了代理转发、端口转发和自动化脚本中的应用。通过案例研究展示了这些技术在企业环境中的应
Adam's CAR架构全解析:设计到部署的终极指南
# 摘要
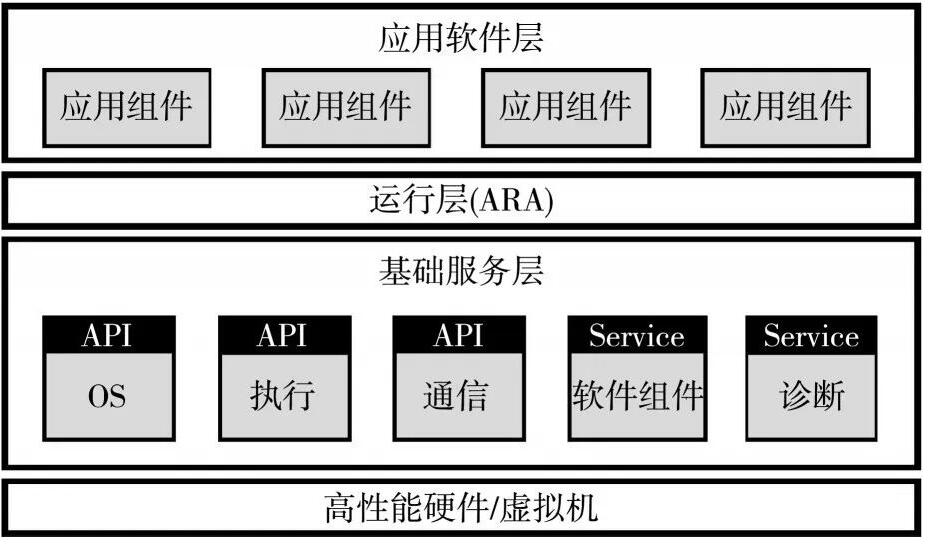
本文全面介绍了一个名为Adam's CAR架构的技术框架,涵盖了从理论基础到实际部署的多个方面。首先,概述了CAR架构的设计原则,包括模块化、可扩展性以及数据流分析,随后详细探讨了核心组件的技术细节、故障处理、容错设计和组件定制化。文章进一步阐述了架构的部署策略、性能调优和CI/CD流程,以及这些实践如何在实际案例中得到成功应用。最后,对未来CAR架构的发展趋势进行预测,探讨了技术创新点和社会责任方面,旨在提供一个可持续发展
【国赛C题算法精进秘籍】:专家教你如何选择与调整算法
# 摘要
随着计算机科学的发展,算法已成为解决问题的核心工具,对算法的理解和选择对提升计算效率和解决问题至关重要。本文首先对算法基础知识进行概览,然后深入探讨算法选择的理论基础,包括算法复杂度分析和数据结构对算法选择的影响,以及算法在不同场景下的适用性。接着,本文介绍了算法调整与优化技巧,强调了基本原理与实用策略。在实践层面,通过案例分析展示算
【PLSQL-Developer连接缓冲技术】:揭秘减少连接断开重连的20年智慧
# 摘要
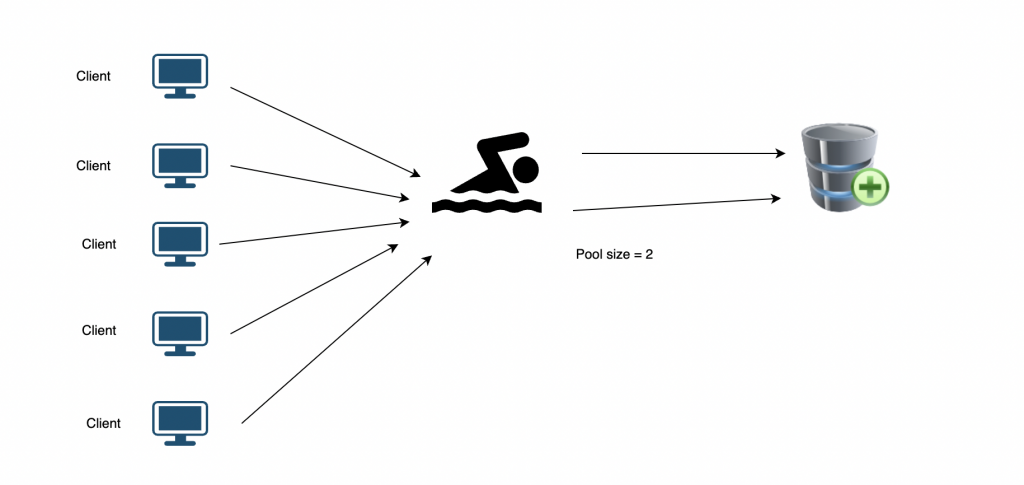
随着数据库技术的快速发展,连接缓冲技术成为了提高数据库连接效率和性能的重要手段。本文首先对PLSQL-Developer中连接缓冲技术进行了概述,进一步探讨了其基础理论,包括数据库连接原理、缓冲技术的基本概念及其工作机制。在实践中,文章着重介绍了如何通过连接缓冲减少断开连接的策略、故障排除方法,以及高级连接缓冲管理技术。此外,本文还着重论述了连接缓冲的性能调优,以
Windows 7 SP1启动失败?高级恢复与修复技巧大公开
# 摘要
本文对Windows 7 SP1启动失败问题进行了全面的概述和分析,并详细介绍了利用高级启动选项、系统文件修复以及系统映像恢复等多种技术手段进行故障排除的方法。通过对启动选项的理论基础和实践操作的探讨,本文指导用户如何在不同情况下采取相应的修复策略。同时,本文也提供了对于系统映像恢复的理论依据和具体实践步骤,以确保用户在面临系统损坏时能
【业务需求分析】:专家如何识别并深入分析业务需求

# 摘要
业务需求分析是确保项目成功的关键环节,涉及到对项目目标、市场环境、用户期望以及技术实现的深入理解。本文首先介绍了业务需求分析的基本概念与重要性,随后探讨了识别业务需求的理论与技巧,包括需求收集方法和分析框架。通过实践案例的分析,文章阐述了需求分析在项目不同阶段的应用,并讨论了数据分析技术、自动化工具和业务规则对需求分析的贡献。最后,本文展望了人工智能、跨界
揭秘TI 28X系列DSP架构:手册解读与实战应用(专家级深度剖析)

# 摘要
本论文全面介绍了TI 28X系列数字信号处理器(DSP)的架构、核心特性、编程模型和指令集,以及在系统集成、开发环境中的应用,并通过多个应用案例展示了其在信号处理、实时控制和高性能计算领域的实际运用。通过对DSP的深入分析,本文揭示了其在处理高密度数学运算和实现并行计算方面的强大能力
【实战案例分析】:DROID-SLAM在现实世界中的应用与挑战解决
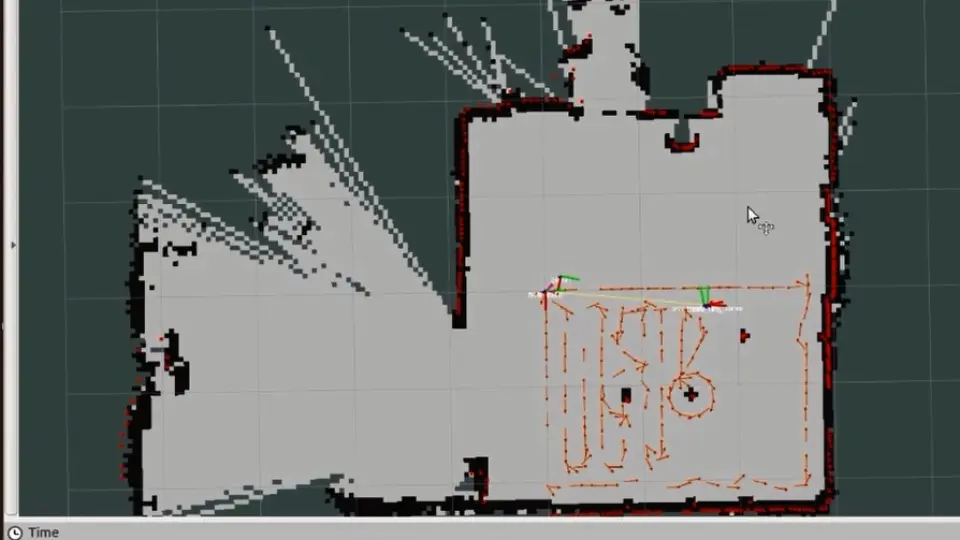
# 摘要
DROID-SLAM技术作为即时定位与地图构建(SLAM)领域的新兴分支,集成了传统SLAM的技术精髓,并通过创新性地融入深度学习与机器人技术,显著提升了定位精度与环境感知能力。本文首先介绍了DROID-SLAM的技术概述、理论基础与关键技术,详细分析了视觉里程计和后端优化算法的实现原理及其演进。随后,本文探讨了DRO
Swift报文完整性验证:6个技术细节确保数据准确无误
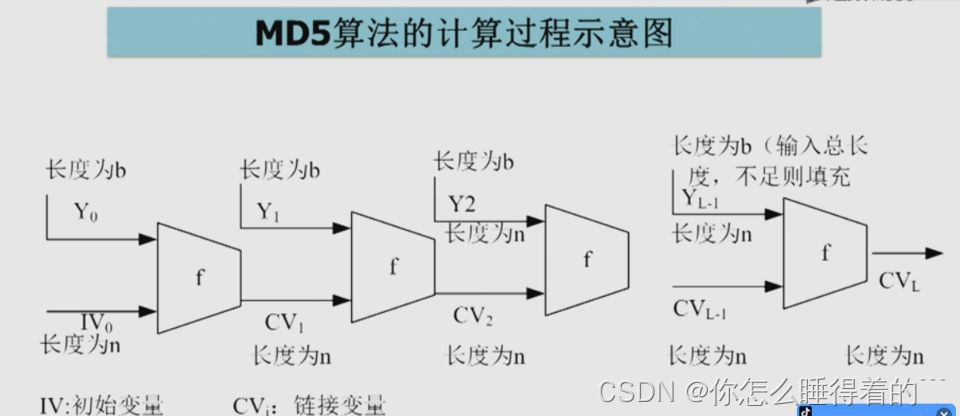
# 摘要
本文旨在全面概述Swift报文完整性验证的原理、实施及安全性考量。文章首先介绍了报文完整性验证的基本概念,阐述了数据完整性对于系统安全的重要性,并讨论了报文验证在不同应用场景中的目的和作用。接着,文章深入探讨了哈希函数和数字签名机制等关键技术在Swift报文验证中的应用,并详细介绍了技术实施过程中的步骤、常见错误处理以及性能优化策略。通过实践案例分析,文章进一步展示了Swift报文完整性验证
资源上传下载、课程学习等过程中有任何疑问或建议,欢迎提出宝贵意见哦~我们会及时处理!
点击此处反馈


专栏目录
最低0.47元/天 解锁专栏
买1年送3月
百万级
高质量VIP文章无限畅学
千万级
优质资源任意下载
C知道
免费提问 ( 生成式Al产品 )