OpenCV轮廓提取与目标识别:赋能机器视觉应用,让计算机看得更聪明
发布时间: 2024-08-09 10:48:52 阅读量: 13 订阅数: 18 

# 1. OpenCV轮廓提取基础**
轮廓提取是计算机视觉中的一项基本技术,用于从图像中提取对象的形状和边界。OpenCV(Open Source Computer Vision Library)是一个流行的计算机视觉库,提供了强大的轮廓提取功能。
在OpenCV中,轮廓表示为一组点,这些点连接起来形成对象的边界。轮廓提取过程涉及以下步骤:
1. **边缘检测:**使用边缘检测算法(如Canny或Sobel)检测图像中的边缘。
2. **轮廓查找:**使用轮廓查找算法(如findContours)找到图像中的轮廓。
3. **轮廓近似:**使用轮廓近似算法(如approxPolyDP)简化轮廓,使其更容易分析和处理。
# 2. 轮廓提取算法详解
轮廓提取算法是计算机视觉领域中的重要技术,用于从图像中提取对象的轮廓。OpenCV提供了多种轮廓提取算法,包括边缘检测算法和轮廓查找算法。
### 2.1 边缘检测算法
边缘检测算法用于检测图像中像素之间的不连续性,从而识别对象的边界。OpenCV中常用的边缘检测算法包括Canny边缘检测和Sobel边缘检测。
#### 2.1.1 Canny边缘检测
Canny边缘检测算法是一种多阶段边缘检测算法,它通过以下步骤检测边缘:
1. **降噪:**使用高斯滤波器对图像进行降噪,以去除图像中的噪声。
2. **梯度计算:**使用Sobel算子计算图像的梯度,梯度表示像素值的变化率。
3. **非极大值抑制:**沿梯度方向搜索每个像素,并保留梯度最大的像素。
4. **阈值化:**使用两个阈值(高阈值和低阈值)对梯度图像进行阈值化。高阈值用于检测强边缘,低阈值用于检测弱边缘。
5. **滞后阈值化:**使用滞后阈值化技术连接弱边缘和强边缘,形成完整的边缘。
```python
import cv2
import numpy as np
# 读取图像
image = cv2.imread('image.jpg')
# 转换为灰度图像
gray = cv2.cvtColor(image, cv2.COLOR_BGR2GRAY)
# 应用 Canny 边缘检测
edges = cv2.Canny(gray, 100, 200)
# 显示边缘检测结果
cv2.imshow('Edges', edges)
cv2.waitKey(0)
cv2.destroyAllWindows()
```
**逻辑分析:**
* `cv2.Canny(gray, 100, 200)`:使用Canny边缘检测算法检测边缘,其中100和200分别是低阈值和高阈值。
* `cv2.imshow('Edges', edges)`:显示边缘检测结果。
#### 2.1.2 Sobel边缘检测
Sobel边缘检测算法是一种一阶边缘检测算法,它使用Sobel算子计算图像的梯度。Sobel算子是一种3x3卷积核,用于分别计算图像水平和垂直方向的梯度。
```python
import cv2
import numpy as np
# 读取图像
image = cv2.imread('image.jpg')
# 转换为灰度图像
gray = cv2.cvtColor(image, cv2.COLOR_BGR2GRAY)
# 应用 Sobel 边缘检测
sobelx = cv2.Sobel(gray, cv2.CV_64F, 1, 0, ksize=5)
sobely = cv2.Sobel(gray, cv2.CV_64F, 0, 1, ksize=5)
# 计算梯度幅度
gradient = np.sqrt(sobelx**2 + sobely**2)
# 归一化梯度幅度
gradient = cv2.normalize(gradient, None, 0, 255, cv2.NORM_MINMAX)
# 显示边缘检测结果
cv2.imshow('Sobel Edges', gradient)
cv2.waitKey(0)
cv2.destroyAllWindows()
```
**逻辑分析:**
* `cv2.Sobel(gray, cv2.CV_64F, 1, 0, ksize=5)`:使用Sobel算子计算水平方向的梯度。
* `cv2.Sobel(gray, cv2.CV_64F, 0, 1, ksize=5)`:使用Sobel算子计算垂直方向的梯度。
* `np.sqrt(sobelx**2 + sobely**2)`:计算梯度幅度。
* `cv2.normalize(gradient, None, 0, 255, cv2.NORM_MINMAX)`:归一化梯度幅度到0-255范围。
* `cv2.imshow('Sobel Edges', gradient)`:显示边缘检测结果。
### 2.2 轮廓查找算法
轮廓查找算法用于从边缘检测结果中提取对象的轮廓。OpenCV中常用的轮廓查找算法包括找轮廓和近似轮廓。
#### 2.2.1 找轮廓
`findContours`函数用于从边缘检测结果中找到轮廓。它使用深度优先搜索算法来遍历边缘像素,并连接具有相同强度的像素形成轮廓。
```python
import cv2
import numpy as np
# 读取图像
image = cv2.imread('image.jpg')
# 转换为灰度图像
gray = cv2.cvtColor(image, cv2.COLOR_BGR2GRAY)
# 应用 Canny 边缘检测
edges = cv2.Canny(gray, 100, 200)
# 找轮廓
contours, hierarchy = cv2.findContours(edges, cv2.RETR_EXTERNAL, cv2.CHAIN_APPROX_SIMPLE)
# 绘制轮廓
cv2.drawContours(image, contours, -1, (0, 255, 0), 2)
# 显示轮廓提取结果
cv2.imshow('Contours', image)
cv2.waitKey(0)
cv2.destroyAllWindows()
```
**逻辑分析:**
* `cv2.findContours(edges, cv2.RETR_EXTERNAL, cv2.CHAIN_APPROX_SIMPLE)`:使用`findContours`函数找到轮廓。`cv2.RETR_EXTERNAL`表示只找外部轮廓,`cv2.CHAIN_APPROX_SIMPLE`表示只保留轮廓的端点。
* `cv2.drawContours(image, contours, -1, (0, 255, 0), 2)`:在原图像上绘制轮廓。
#### 2.2.2 近似轮廓
`approxPolyDP`函数用于对轮廓进行近似,将其简化为由直线段组成的多边形。这可以用于减少轮廓的复杂度,并提取对象的形状特征。
```python
import cv2
import numpy as np
# 读取图像
image = cv2.imread('image.jpg')
# 转换为灰度图像
gray = cv2.cvtColor(image, cv2.COLOR_BGR2GRAY)
# 应用 Canny 边缘检测
edges = cv2.Canny(gray, 100, 200)
# 找轮廓
contours, hierarchy = cv2.findContours(edges, cv2.RETR_E
```
 最低0.47元/天 解锁专栏
 送3个月
 百万级
高质量VIP文章无限畅学
百万级
高质量VIP文章无限畅学
 千万级
优质资源任意下载
千万级
优质资源任意下载
 C知道
免费提问 ( 生成式Al产品 )
C知道
免费提问 ( 生成式Al产品 )
0
0
相关推荐

专栏简介
OpenCV轮廓提取专栏是一份全面的指南,旨在帮助您从图像中提取物体形状。它涵盖了从基础知识到高级技术的各个方面,包括Canny边缘检测、轮廓查找算法、优化技巧、图像分割、目标识别、计算机视觉、深度学习、医学图像处理、工业检测、机器人视觉、人脸识别、交通监控、安防监控、无人驾驶、遥感图像处理和目标跟踪。无论您是初学者还是专家,本专栏都会为您提供宝贵的见解和实用技巧,帮助您充分利用OpenCV轮廓提取功能,解锁图像理解和计算机视觉的强大潜力。
专栏目录
最低0.47元/天 解锁专栏
送3个月
百万级
高质量VIP文章无限畅学
千万级
优质资源任意下载
C知道
免费提问 ( 生成式Al产品 )
最新推荐
Parallelization Techniques for Matlab Autocorrelation Function: Enhancing Efficiency in Big Data Analysis
# 1. Introduction to Matlab Autocorrelation Function
The autocorrelation function is a vital analytical tool in time-domain signal processing, capable of measuring the similarity of a signal with itself at varying time lags. In Matlab, the autocorrelation function can be calculated using the `xcorr
Python序列化与反序列化高级技巧:精通pickle模块用法

# 1. Python序列化与反序列化概述
在信息处理和数据交换日益频繁的今天,数据持久化成为了软件开发中不可或缺的一环。序列化(Serialization)和反序列化(Deserialization)是数据持久化的重要组成部分,它们能够将复杂的数据结构或对象状态转换为可存储或可传输的格式,以及还原成原始数据结构的过程。
序列化通常用于数据存储、
Technical Guide to Building Enterprise-level Document Management System using kkfileview
# 1.1 kkfileview Technical Overview
kkfileview is a technology designed for file previewing and management, offering rapid and convenient document browsing capabilities. Its standout feature is the support for online previews of various file formats, such as Word, Excel, PDF, and more—allowing user
Analyzing Trends in Date Data from Excel Using MATLAB
# Introduction
## 1.1 Foreword
In the current era of information explosion, vast amounts of data are continuously generated and recorded. Date data, as a significant part of this, captures the changes in temporal information. By analyzing date data and performing trend analysis, we can better under
Image Processing and Computer Vision Techniques in Jupyter Notebook
# Image Processing and Computer Vision Techniques in Jupyter Notebook
## Chapter 1: Introduction to Jupyter Notebook
### 2.1 What is Jupyter Notebook
Jupyter Notebook is an interactive computing environment that supports code execution, text writing, and image display. Its main features include:
-
Pandas中的数据可视化:绘图与探索性数据分析的终极武器
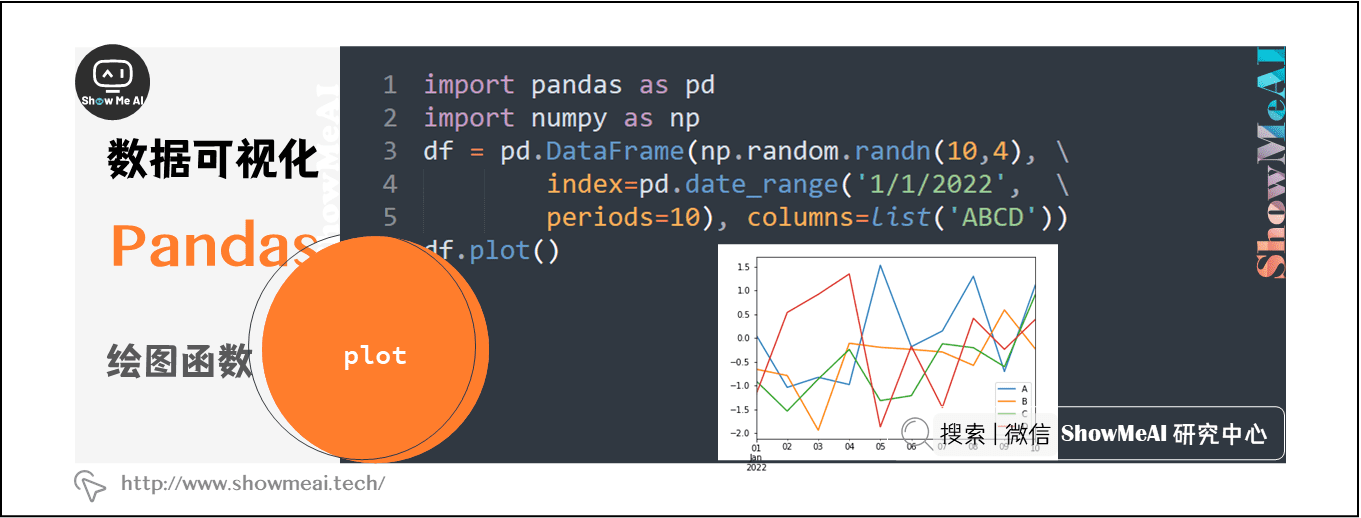
# 1. Pandas与数据可视化的基础介绍
在数据分析领域,Pandas作为Python中处理表格数据的利器,其在数据预处理和初步分析中扮演着重要角色。同时,数据可视化作为沟通分析结果的重要方式,使得数据的表达更为直观和易于理解。本章将为读者提供Pandas与数据可视化基础知识的概览。
Pandas的DataFrames提供了数据处理的丰富功能,包括索引设置、数据筛选、
Expert Tips and Secrets for Reading Excel Data in MATLAB: Boost Your Data Handling Skills
# MATLAB Reading Excel Data: Expert Tips and Tricks to Elevate Your Data Handling Skills
## 1. The Theoretical Foundations of MATLAB Reading Excel Data
MATLAB offers a variety of functions and methods to read Excel data, including readtable, importdata, and xlsread. These functions allow users to
[Frontier Developments]: GAN's Latest Breakthroughs in Deepfake Domain: Understanding Future AI Trends
# 1. Introduction to Deepfakes and GANs
## 1.1 Definition and History of Deepfakes
Deepfakes, a portmanteau of "deep learning" and "fake", are technologically-altered images, audio, and videos that are lifelike thanks to the power of deep learning, particularly Generative Adversarial Networks (GANs
Installing and Optimizing Performance of NumPy: Optimizing Post-installation Performance of NumPy
# 1. Introduction to NumPy
NumPy, short for Numerical Python, is a Python library used for scientific computing. It offers a powerful N-dimensional array object, along with efficient functions for array operations. NumPy is widely used in data science, machine learning, image processing, and scient
PyCharm Python Version Management and Version Control: Integrated Strategies for Version Management and Control
# Overview of Version Management and Version Control
Version management and version control are crucial practices in software development, allowing developers to track code changes, collaborate, and maintain the integrity of the codebase. Version management systems (like Git and Mercurial) provide
资源上传下载、课程学习等过程中有任何疑问或建议,欢迎提出宝贵意见哦~我们会及时处理!
点击此处反馈


专栏目录
最低0.47元/天 解锁专栏
送3个月
百万级
高质量VIP文章无限畅学
千万级
优质资源任意下载
C知道
免费提问 ( 生成式Al产品 )