帕累托分布在IT运维可视化中的应用:80_20法则下的可视化运维与数据洞察
发布时间: 2024-07-07 17:44:09 阅读量: 49 订阅数: 22 
# 1. 帕累托分布概述
帕累托分布,也称为80/20法则,是一种幂律分布,它描述了一个不平衡的现象,即大多数结果是由少数原因造成的。在IT运维中,帕累托分布广泛应用于故障分析、资源分配和性能监控等领域。
### 帕累托分布的特点
* **不平衡性:**帕累托分布的特点是少数原因导致了大多数结果。例如,在故障分析中,80%的故障可能由20%的根本原因引起。
* **幂律关系:**帕累托分布遵循幂律关系,即分布中较大的值比较小的值出现得更频繁。这表明,少数高影响因素对整体结果有不成比例的影响。
* **自相似性:**帕累托分布具有自相似性,这意味着它在不同的尺度上表现出相似的模式。例如,在资源分配中,80%的资源可能被20%的应用程序使用,而这20%的应用程序中,80%的资源又可能被20%的进程使用。
# 2. 帕累托分布在IT运维中的应用
帕累托分布在IT运维中具有广泛的应用,它可以帮助运维人员深入了解和优化系统性能、资源分配和故障管理。
### 2.1 故障分析和优先级排序
帕累托分布在故障分析和优先级排序中发挥着至关重要的作用。根据帕累托原理,80% 的故障是由 20% 的原因造成的。通过识别和解决这 20% 的原因,运维人员可以显著减少故障的发生率和影响。
```python
import pandas as pd
import numpy as np
# 故障数据
故障_df = pd.DataFrame({
"故障原因": ["硬件故障", "软件错误", "网络问题", "人为失误"],
"故障次数": [50, 20, 15, 10]
})
# 计算帕累托百分比
故障_df["帕累托百分比"] = np.cumsum(故障_df["故障次数"]) / np.sum(故障_df["故障次数"]) * 100
# 打印帕累托图
print(故障_df)
```
**代码逻辑分析:**
1. 使用 `pandas` 库读取故障数据并创建数据框 `故障_df`。
2. 计算每个故障原因的累积帕累托百分比,并将其存储在 `帕累托百分比` 列中。
3. 打印数据框,显示故障原因及其对应的帕累托百分比。
**参数说明:**
* `故障_df`:故障数据数据框
* `帕累托百分比`:每个故障原因的累积帕累托百分比
### 2.2 资源分配和优化
帕累托分布还可以用于优化资源分配。通过识别和优先分配资源给最关键的领域,运维人员可以最大化资源利用率并提高系统性能。
```mermaid
graph LR
subgraph 资源分配
A[硬件] --> B[80%]
A --> C[20%]
end
```
**流程图分析:**
流程图展示了资源分配的帕累托分布。
* 80% 的资源分配给硬件(A → B)。
* 20% 的资源分配给其他领域(A → C)。
### 2.3 性能监控和异常检测
帕累托分布在性能监控和异常检测中也至关重要。通过识别和关注系统中表现最差的 20% 的区域,运维人员可以快速发现性能瓶颈并采取纠正措施。
```python
import matplotlib.pyplot as plt
# 性能数据
性能_df = pd.DataFrame({
"指标": ["CPU利用率", "内存使用率", "网络带宽"],
"平均值": [50, 60, 70],
"最大值": [80, 90, 100]
})
# 绘制帕累托图
plt.figure(figsize=(10, 5))
plt.bar(性能_df["指标"], 性能_df["平均值"], color="blue")
plt.bar(性能_df["指标"], 性能_df["最大值"], color="red")
plt.xlabel("指标")
plt.ylabel("值")
plt.title("性能帕累托图")
plt.show()
```
**代码逻辑分析:**
1. 使用 `matplotlib` 库创建帕累托图。
2. 绘制性能指标的平均值和最大值,以条形图的形式显示。
3. 通过比较平均值和最大值,运维人员可以识别性能表现最差的指标。
**参数说明:**
* `性能_df`:性能数据数据框
* `figsize`:帕累托图的大小
* `color`:条形图的颜色
# 3. 帕累托分布可视化技术
### 3.1 直方图和帕累托图
**直方图**是一种统计图形,它将数据分布可视化为一系列垂直条形。每个条形表示特定范围内的值的数量。对于帕累托分布,直方图通常显示一个向右偏斜的分布,其中较小的值出现频率更高,而较大的值出现频率较低。
**帕累托图**是直方图的一种变体,它将数据按降序排列,并累积显示每个值的百分比。帕累托图有助于识别“80/20”规则,即大约 80% 的问题是由 20% 的原因造成的。
**代码块:**
```python
import matplotlib.pyplot as plt
import numpy as np
# 生成帕累托分布数据
data = np.random.pareto(a=2, size=1000)
# 创建直方图
plt.hist(data, bins=20)
plt.xlabel("Value")
plt.ylabel("Frequency")
plt.title("帕累托分布直方图")
plt.show()
# 创建帕累托图
data = np.sort(data)[::-1]
cumulative_percentages = np.cumsum(da
```

 百万级
高质量VIP文章无限畅学
百万级
高质量VIP文章无限畅学
 千万级
优质资源任意下载
千万级
优质资源任意下载
 C知道
免费提问 ( 生成式Al产品 )
C知道
免费提问 ( 生成式Al产品 )
0
0
相关推荐

专栏简介
**帕累托分布在IT运维中的应用**
帕累托分布,也称为80/20法则,是一种统计分布,描述了大量事件中少数事件对整体结果的重大影响。本专栏深入探讨了帕累托分布在IT运维各个方面的应用,包括:
* 故障分析:快速识别关键故障点,缩短故障排除时间。
* 资源分配:优化配置,提高运维效率。
* 项目管理:提高项目成功率,遵循80/20法则。
* 服务质量管理:提升服务质量,专注于产生最大影响的领域。
* 安全威胁分析:识别和应对80%的安全威胁。
* 容量规划:优化容量,避免资源浪费。
* 成本管理:优化成本,专注于产生最大影响的领域。
* 变更管理:制定有效的变更管理策略,最大限度减少中断。
* 监控:优化监控策略,专注于关键指标。
* 自动化:提高运维效率,实现80/20法则。
* 故障预测:预测和预防80%的故障。
* 团队管理:优化团队管理,提高绩效。
* 流程优化:优化流程,提高效率。
* 数据分析:利用80/20法则进行数据分析,支持决策。
* 可视化:实现可视化运维,获得数据洞察。
* 人工智能:将80/20法则应用于AI运维,提高智能化水平。
专栏目录
最低0.47元/天 解锁专栏
买1年送3月
百万级
高质量VIP文章无限畅学
千万级
优质资源任意下载
C知道
免费提问 ( 生成式Al产品 )
最新推荐
激活函数理论与实践:从入门到高阶应用的全面教程

# 1. 激活函数的基本概念
在神经网络中,激活函数扮演了至关重要的角色,它们是赋予网络学习能力的关键元素。本章将介绍激活函数的基础知识,为后续章节中对具体激活函数的探讨和应用打下坚实的基础。
## 1.1 激活函数的定义
激活函数是神经网络中用于决定神经元是否被激活的数学函数。通过激活函数,神经网络可以捕捉到输入数据的非线性特征。在多层网络结构
【损失函数与随机梯度下降】:探索学习率对损失函数的影响,实现高效模型训练

# 1. 损失函数与随机梯度下降基础
在机器学习中,损失函数和随机梯度下降(SGD)是核心概念,它们共同决定着模型的训练过程和效果。本
极端事件预测:如何构建有效的预测区间

# 1. 极端事件预测概述
极端事件预测是风险管理、城市规划、保险业、金融市场等领域不可或缺的技术。这些事件通常具有突发性和破坏性,例如自然灾害、金融市场崩盘或恐怖袭击等。准确预测这类事件不仅可挽救生命、保护财产,而且对于制定应对策略和减少损失至关重要。因此,研究人员和专业人士持
【实时系统空间效率】:确保即时响应的内存管理技巧

# 1. 实时系统的内存管理概念
在现代的计算技术中,实时系统凭借其对时间敏感性的要求和对确定性的追求,成为了不可或缺的一部分。实时系统在各个领域中发挥着巨大作用,比如航空航天、医疗设备、工业自动化等。实时系统要求事件的处理能够在确定的时间内完成,这就对系统的设计、实现和资源管理提出了独特的挑战,其中最为核心的是内存管理。
内存管理是操作系统的一个基本组成部
时间序列分析的置信度应用:预测未来的秘密武器
# 1. 时间序列分析的理论基础
在数据科学和统计学中,时间序列分析是研究按照时间顺序排列的数据点集合的过程。通过对时间序列数据的分析,我们可以提取出有价值的信息,揭示数据随时间变化的规律,从而为预测未来趋势和做出决策提供依据。
## 时间序列的定义
时间序列(Time Series)是一个按照时间顺序排列的观测值序列。这些观测值通常是一个变量在连续时间点的测量结果,可以是每秒的温度记录,每日的股票价
学习率对RNN训练的特殊考虑:循环网络的优化策略
# 1. 循环神经网络(RNN)基础
## 循环神经网络简介
循环神经网络(RNN)是深度学习领域中处理序列数据的模型之一。由于其内部循环结
Epochs调优的自动化方法
# 1. Epochs在机器学习中的重要性
机器学习是一门通过算法来让计算机系统从数据中学习并进行预测和决策的科学。在这一过程中,模型训练是核心步骤之一,而Epochs(迭代周期)是决定模型训练效率和效果的关键参数。理解Epochs的重要性,对于开发高效、准确的机器学习模型至关重要。
在后续章节中,我们将深入探讨Epochs的概念、如何选择合适值以及影响调优的因素,以及如何通过自动化方法和工具来优化Epochs的设置,从而
机器学习性能评估:时间复杂度在模型训练与预测中的重要性
# 1. 机器学习性能评估概述
## 1.1 机器学习的性能评估重要性
机器学习的性能评估是验证模型效果的关键步骤。它不仅帮助我们了解模型在未知数据上的表现,而且对于模型的优化和改进也至关重要。准确的评估可以确保模型的泛化能力,避免过拟合或欠拟合的问题。
## 1.2 性能评估指标的选择
选择正确的性能评估指标对于不同类型的机器学习任务至关重要。例如,在分类任务中常用的指标有
【算法竞赛中的复杂度控制】:在有限时间内求解的秘籍
# 1. 算法竞赛中的时间与空间复杂度基础
## 1.1 理解算法的性能指标
在算法竞赛中,时间复杂度和空间复杂度是衡量算法性能的两个基本指标。时间复杂度描述了算法运行时间随输入规模增长的趋势,而空间复杂度则反映了算法执行过程中所需的存储空间大小。理解这两个概念对优化算法性能至关重要。
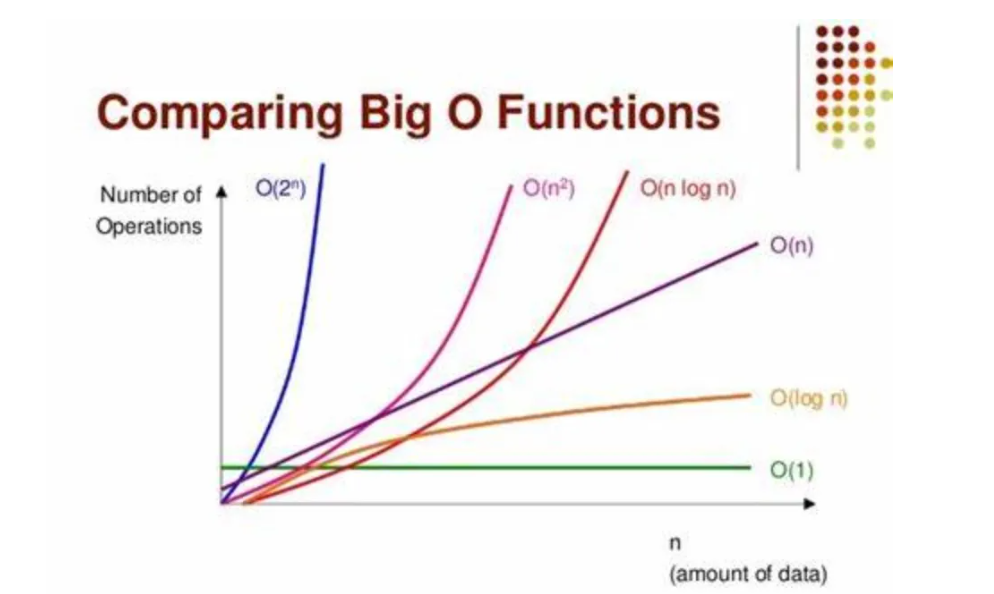
## 1.2 大O表示法的含义与应用
大O表示法是用于描述算法时间复杂度的一种方式。它关注的是算法运行时
【批量大小与存储引擎】:不同数据库引擎下的优化考量

# 1. 数据库批量操作的理论基础
数据库是现代信息系统的核心组件,而批量操作作为提升数据库性能的重要手段,对于IT专业人员来说是不可或缺的技能。理解批量操作的理论基础,有助于我们更好地掌握其实践应用,并优化性能。
## 1.1 批量操作的定义和重要性
批量操作是指在数据库管理中,一次性执行多个数据操作命
资源上传下载、课程学习等过程中有任何疑问或建议,欢迎提出宝贵意见哦~我们会及时处理!
点击此处反馈


专栏目录
最低0.47元/天 解锁专栏
买1年送3月
百万级
高质量VIP文章无限畅学
千万级
优质资源任意下载
C知道
免费提问 ( 生成式Al产品 )