数值转换与数据可视化:提升图表和仪表盘的准确性
发布时间: 2024-07-14 16:00:39 阅读量: 37 订阅数: 49 

Scratch图形化编程语言入门与进阶指南
# 1. 数值转换与数据可视化的基础
### 1.1 数值转换
数值转换是指将一种数据类型或单位转换为另一种数据类型或单位的过程。在数据处理和分析中,数值转换是至关重要的,因为它可以确保数据的兼容性和可比性。
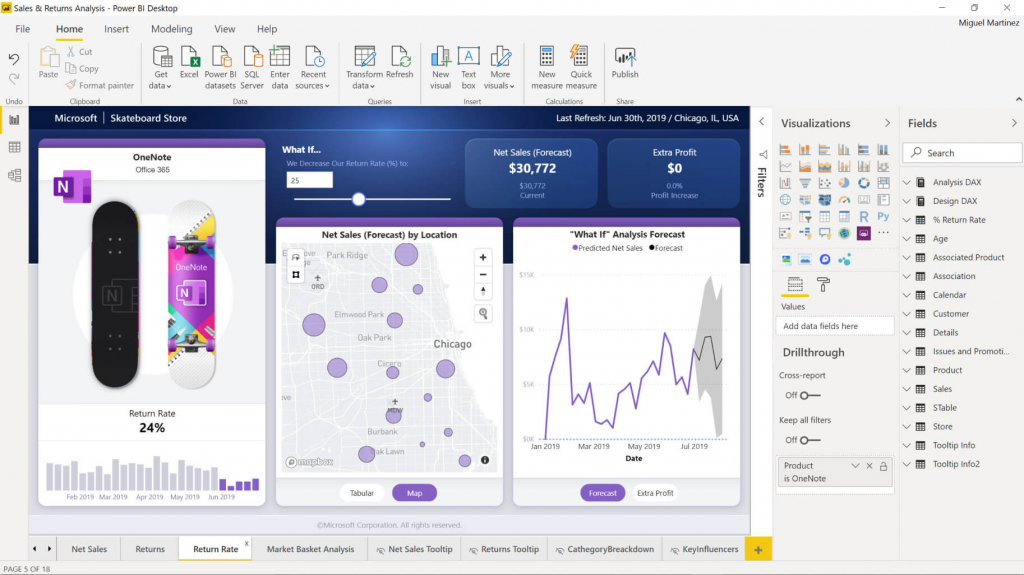
### 1.2 数据可视化
数据可视化是指将数据以图形或图表的形式呈现的过程。它可以帮助人们快速直观地理解和分析数据,从而做出更好的决策。数据可视化的类型多种多样,包括条形图、折线图、饼图和仪表盘等。
# 2. 数值转换的理论与实践
### 2.1 数值转换的类型和方法
数值转换是指将一种数据类型或单位转换为另一种数据类型或单位的过程。它在数据处理、分析和可视化中至关重要,可以确保数据的一致性、准确性和可比性。
#### 2.1.1 数据类型转换
数据类型转换涉及将一种数据类型转换为另一种数据类型,例如:
- 整数到浮点数:`int(10) -> 10.0`
- 浮点数到整数:`round(3.14) -> 3`
- 字符串到整数:`int("10") -> 10`
- 字符串到浮点数:`float("3.14") -> 3.14`
#### 2.1.2 单位转换
单位转换涉及将一种单位转换为另一种单位,例如:
- 公里到英里:`10 km -> 6.21 mi`
- 英寸到厘米:`10 in -> 25.4 cm`
- 华氏度到摄氏度:`100 °F -> 37.8 °C`
### 2.2 数值转换的精度和误差
在数值转换过程中,精度和误差是需要考虑的重要因素。
#### 2.2.1 精度分析
精度是指转换后数据的准确程度。它受以下因素影响:
- **原始数据的精度:**转换前的原始数据精度越高,转换后的数据精度也越高。
- **转换方法:**不同的转换方法具有不同的精度,例如浮点数到整数的转换可能会损失精度。
#### 2.2.2 误差控制
误差是指转换后数据与原始数据之间的差异。它受以下因素影响:
- **舍入误差:**在转换过程中,小数部分可能会被舍入,导致误差。
- **截断误差:**在转换过程中,小数部分可能会被截断,导致误差。
- **量化误差:**当连续数据被转换为离散数据时,可能会出现量化误差。
为了控制误差,可以采用以下方法:
- **使用高精度的数据类型:**使用浮点数或双精度浮点数等高精度数据类型可以减少舍入误差。
- **使用适当的转换方法:**选择最适合特定转换的转换方法可以减少截断误差。
- **进行误差分析:**分析转换后的数据与原始数据之间的误差,并根据需要进行调整。
# 3.1 数据可视化的类型和原则
#### 3.1.1 图表类型
数据可视化中常用的图表类型包括:
-

 百万级
高质量VIP文章无限畅学
百万级
高质量VIP文章无限畅学
 千万级
优质资源任意下载
千万级
优质资源任意下载
 C知道
免费提问 ( 生成式Al产品 )
C知道
免费提问 ( 生成式Al产品 )
0
0
相关推荐

专栏简介
数值转换专栏深入探讨了数据处理中数值转换的关键技巧,揭示了隐藏的陷阱和避免数据失真的方法。它提供了从源类型到目标类型的进阶指南,并着重于提升代码效率和浮点数转换的奥秘。专栏还深入分析了整型转换、字符串到数值转换以及数据清洗和分析中的数值转换。此外,它还强调了跨平台兼容性、数据安全、数据完整性、数据可视化、机器学习、数据库优化、分布式系统、云计算、物联网、金融科技和医疗保健中的数值转换应用。通过深入浅出的讲解,专栏旨在帮助数据处理人员掌握数值转换的精髓,避免错误,并优化数据处理流程。
专栏目录
最低0.47元/天 解锁专栏
买1年送3月
百万级
高质量VIP文章无限畅学
千万级
优质资源任意下载
C知道
免费提问 ( 生成式Al产品 )
最新推荐
电子行业物流优化:EIA-481-D中文版的实际应用案例分析
# 摘要
EIA-481-D标准作为一种行业规范,对电子行业的物流流程产生深远影响,通过优化物料包装和标识追踪,有效减少物流错误,降低成本。该标准不仅提高了供应链的效率和透明度,也促进了质量管理的改进。本文介绍了EIA-481-D标准的内涵、物流优化原理及其在供应链中的作用,并通过多个实际应用案例,分析了不同规模企业实施标准的经验和挑战。此外,文章还探讨了电子行业物流优化的实践策略,包括流程优化、技术支持及持续改进方法,并对标准未来的发展趋势进行了展望。
# 关键字
EIA-481-D标准;物流优化;供应链管理;质量管理体系;实践策略;电子元件分销商
参考资源链接:[EIA-481-D中文
SAPSD定价逻辑优化:提升效率的10大策略与技巧

# 摘要
SAPSD定价逻辑是集成了基本定价原则、核心算法和市场适应性分析的复杂系统,旨在为企业提供高效的定价策略。本文首先概述了SAPSD定价逻辑及其理论基础,重点分析了其基本原则、核心算法及市场适应性。接着,探讨了通过数据驱动、实时定价调整和多维度策略组合等优化策略来改进定价逻辑,这些策略在实践中
绘图专家:ASPEN PLUS 10.0流程图技巧,让工艺流程一目了然
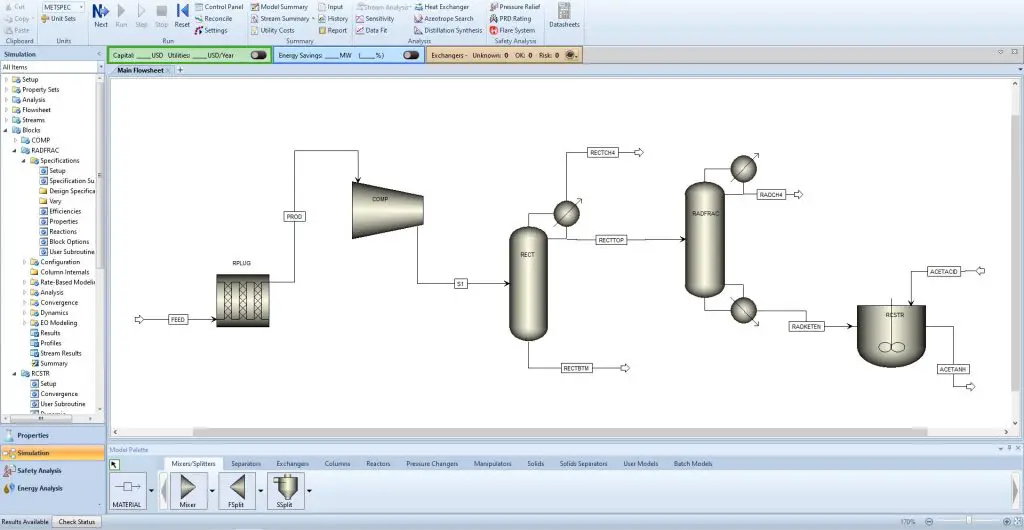
# 摘要
ASPEN PLUS 10.0作为一种强大的化工模拟软件,其流程图功能对于工程设计至关重要。本文全面介绍了ASPEN PLUS 10.0的基本操作、流程图的基本元素和高级技巧,以及其在工艺设计中的具体应用。通过详细阐述流程图的组件、符号、创建编辑方法以及数据流和连接线的管理,本文旨在帮助用户提升流程图的制作质量和效率。同时,深入探讨了自定义图形、模板的创建与应用、复杂流程的简化与可视化以及动态数据链接的重要
Amlogic S805多媒体应用大揭秘:视频音频处理效率提升手册

# 摘要
本文对Amlogic S805多媒体处理器进行了全面介绍和性能优化分析。首先概述了S805的基本特点,随后聚焦于视频和音频处理能力的提升。通过对视频编解码基础、播放性能优化以及高清视频解码器案例的研究,探讨了硬件加速技术和软件层面的优化策略。音频处理章节分析了音频编解码技术要点、播放录制的优化方法和音频增强技术的应用。最后,本文详细描述了多
提升记忆力的系统规划口诀:理论与实践的完美结合

# 摘要
记忆力的提升是认知心理学研究中的重要议题,影响因素多样,包括遗传、环境、生活习惯等。本文首先概述记忆力的理论基础,探讨不同理论模型如多重存储模型和工作记忆模型,并分析记忆力的影响因素。随后,文章详细介绍了科学的记忆力提升方法,包括记忆训练技巧、饮食与生活方式调整,以及认知训练工具和资源的使用。通过实践案例分析,文章进一步展示了记忆力提升的有效策
PLC程序开发优化指南:控制逻辑设计的最佳实践
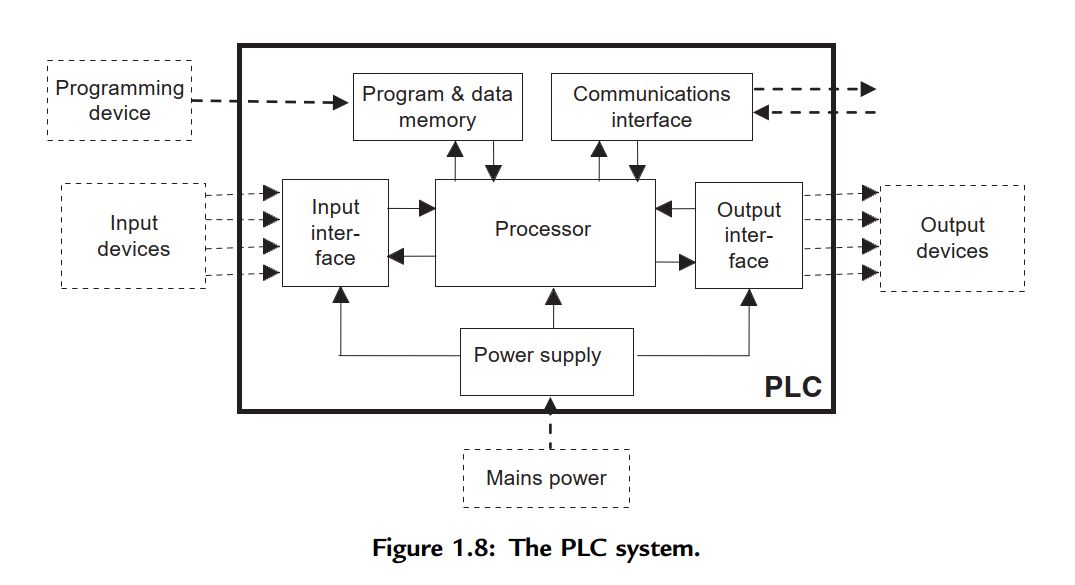
# 摘要
本文综合探讨了PLC(可编程逻辑控制器)程序开发的关键知识和实践技巧,旨在为工程技术人员提供系统的学习和参考。从基础理论、控制逻辑设计到编程实践,再到高级应用和案例研究,文章涵盖了PLC技术的多个重要方面。文中详细阐述了控制逻辑设计的理论基础、编程原则与优化方法,以及在实际应用中需要注意的调试与故障排除技巧。同时,还探讨了PLC在工业通讯和远程监控方面的应用,以及安全性与冗余设计的重要性。最后,文
华为LTE功率计算v1:功率控制算法的详细解读
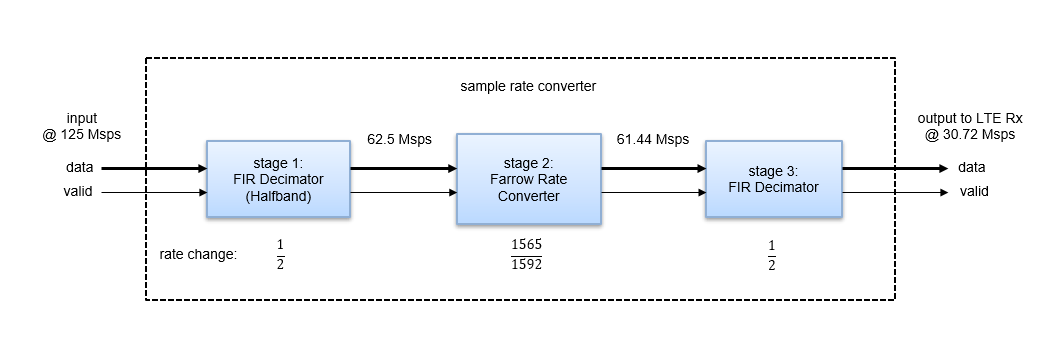
# 摘要
本文综述了华为LTE功率控制的技术细节和应用实践。首先概述了LTE功率控制的基本概念和理论基础,重点分析了功率控制在无线通信中的作用、主要类型及其关键参数。接着深入探讨了华为LTE功率控制算法,包括开环和闭环功率控制策略以及在特定场景下的优化策略。随后,文章详细描述了如何在实际应用中建立功率计算模型,并通过案例研究进行问题诊断与解决。最后,文章分析了当前华为LTE功率控
ADS变压器稳定性改进:揭秘模型分析与优化的核心方法

# 摘要
变压器作为电力系统中的关键设备,其稳定性对于整个电网的可靠运行至关重要。本文首先阐述了变压器稳定性的重要性,然后从理论基础、稳定性分析方法和优化策略三个方面进行了深入探讨。通过ADS软件工具的应用,我们分析了变压器模型的线性和非线性表达,并提出了基于ADS的稳定性仿真方法。此外,文章还探讨了硬件设计与软件算法上的优化策略,
LSM6DS3功耗管理秘籍:延长移动设备续航的策略
# 摘要
LSM6DS3传感器在现代移动设备中广泛使用,其功耗问题直接影响设备性能和续航能力。本文首先对LSM6DS3传感器进行概览,随后深入探讨其功耗管理原理,包括工作模式、理论基础及测试分析方法。接着,文章从软硬件层面分享了功耗管理的实践技巧,并通过案例分析展示了优化成效及挑战。在移动设备中的节能应用方面,本文讨论了数据采集与移动应用层的优化策略,以及跨平台节能技术。最后,文章展望了新技术如低功耗蓝牙和人工智能在功耗管理中的潜在影响,以及绿色能源技术与可持续发展的结合。本研究为移动设备的功耗管理提供了深入见解和实践指导,对未来节能技术的发展趋势进行了预测和建议。
# 关键字
LSM6DS
【多线程编程秘诀】:提升凌华IO卡处理能力的PCI-Dask.dll技巧

# 摘要
多线程编程是提高软件性能的重要技术,尤其在处理IO卡数据时,它能够显著提升数据吞吐和处理效率。本文从多线程基础和原理出发,深入探讨其在IO卡处理中的应用,结合PCI-Dask.dll技术,介绍了如何在多线程环境下进行编程实践以及提升IO卡性能的技巧。通过案例分析,本文分享了优化IO卡性能的成功实践
资源上传下载、课程学习等过程中有任何疑问或建议,欢迎提出宝贵意见哦~我们会及时处理!
点击此处反馈


专栏目录
最低0.47元/天 解锁专栏
买1年送3月
百万级
高质量VIP文章无限畅学
千万级
优质资源任意下载
C知道
免费提问 ( 生成式Al产品 )