发现复杂数据的模式:等高线图在机器学习中的应用,助力人工智能突破
发布时间: 2024-07-10 00:40:35 阅读量: 122 订阅数: 29 

喀什医疗应急科技指挥中心:科技助力 搭起应急救援生命线.rar

# 1. 等高线图的理论基础**
等高线图是一种二维可视化技术,用于表示三维数据的分布。它通过绘制一系列等高线来实现,这些等高线连接具有相同值的点。等高线图广泛用于地理学、气象学和工程等领域。
等高线图的理论基础在于插值,即根据已知数据点估计未知数据点值的过程。在等高线图中,插值通常使用线性插值或样条插值等方法。通过将这些插值值连接起来,可以形成等高线,从而表示数据的分布。
等高线图的优点在于它能够清晰地显示数据的空间分布,并允许用户识别数据中的模式和趋势。它还能够揭示数据中的局部和全局特征,使其成为分析和理解复杂数据的宝贵工具。
# 2. 等高线图在机器学习中的应用
### 2.1 数据可视化和模式识别
等高线图在机器学习中的一项关键应用是数据可视化和模式识别。它允许数据科学家以图形方式表示高维数据集,从而识别模式和趋势。
例如,在图像分类任务中,等高线图可用于可视化图像中像素值的分布。这有助于识别图像中的不同对象,并提取有关其形状、纹理和颜色的信息。
```python
import numpy as np
import matplotlib.pyplot as plt
# 生成一个 2D 高斯分布的数据集
data = np.random.multivariate_normal([0, 0], [[1, 0], [0, 1]], 1000)
# 创建等高线图
plt.contourf(data[:, 0], data[:, 1], np.histogram2d(data[:, 0], data[:, 1], bins=20)[0])
plt.colorbar()
plt.show()
```
**代码逻辑分析:**
* `np.random.multivariate_normal` 生成一个 2D 高斯分布的数据集。
* `np.histogram2d` 计算数据集中每个单元格的像素值计数,并返回一个 2D 数组。
* `plt.contourf` 绘制等高线图,其中每个等高线表示数据集中具有相同像素值计数的区域。
* `plt.colorbar` 添加一个颜色条,以指示等高线的值。
### 2.2 聚类和降维
等高线图还可以用于聚类和降维。聚类涉及将数据点分组到不同的簇中,而降维涉及将高维数据集投影到较低维度的空间中。
在聚类任务中,等高线图可用于可视化数据点之间的相似性。通过识别等高线图中的密集区域,数据科学家可以识别数据中的自然簇。
```python
import numpy as np
import matplotlib.pyplot as plt
from sklearn.cluster import KMeans
# 生成一个 2D 高斯混合分布的数据集
data = np.random.rand(1000, 2)
data[500:] += 2
# 创建 K-Means 聚类器
kmeans = KMeans(n_clusters=2)
# 拟合聚类器
kmeans.fit(data)
# 创建等高线图
plt.contourf(data[:, 0], data[:, 1], kmeans.labels_.reshape(data.shape[0], data.shape[1]))
plt.colorbar()
plt.show()
```
**代码逻辑分析:**
* `np.random.rand` 生成一个 2D 高斯混合分布的数据集。
* `sklearn.cluster.KMeans` 创建一个 K-Means 聚类器,其中 `n_clusters` 参数指定要创建的簇数。
* `kmeans.fit` 拟合聚类器到数据。
* `kmeans.labels_` 返回每个数据点的簇标签。
* `plt.contourf` 绘制等高线图,其中每个等高线表示数据集中具有相同簇标签的区域。
### 2.3 异常检测和预测
等高线图在异常检测和预测任务中也很有用。异常检测涉及识别与数据集中的其他数据点显着不同的数据点,而预测涉及使用历史数据来预测未来事件。
在异常检测任务中,等高线图可用于可视化数据分布并识别异常值。通过识别等高线图中远离主要数据分布的区域,数据科学家可以检测出异常数据点。
```python
import numpy as np
import matplotlib.pyplot as plt
# 生成一个 2D 高斯分布的数据集
data = np.random.multivariate_normal([0, 0], [[1, 0], [0, 1]], 1000)
# 添加一些异常值
data[100:] += 5
# 创建等高线图
plt.contourf(data[:, 0], data[:, 1], np.histogram2d(data[:, 0], data[:, 1], bins=20)[0])
plt.colorbar()
plt.show()
```
**代码逻辑分析:**
* `np.random.multivariate_normal` 生成一个 2D 高斯分布的数据集。
* `data[100:] += 5` 添加一些异常值。
* `np.histogram2d` 计算数据集中每个单元格的像素值计数,并返回一个 2D 数组。
* `plt.contourf` 绘制等高线图,其中每个等高线表示数据集中具有相同像素值计数的区域。
* `plt.colorbar` 添加一个颜色条,以指示等高线的值。

 百万级
高质量VIP文章无限畅学
百万级
高质量VIP文章无限畅学
 千万级
优质资源任意下载
千万级
优质资源任意下载
 C知道
免费提问 ( 生成式Al产品 )
C知道
免费提问 ( 生成式Al产品 )
0
0
相关推荐

专栏简介
等高线图专栏深入探讨了这种强大的数据可视化工具,揭示了其在各个领域的广泛应用。从揭秘等高线图的秘密武器到绘制数据分布的艺术,该专栏提供了全面的指南,帮助读者掌握等高线图的原理和实践。
专栏深入分析了等高线图的优缺点,将其与其他可视化技术进行了比较,指导读者选择合适的工具。它还提供了丰富的行业案例,展示了等高线图在金融、医疗、机器学习、自然语言处理、图像处理、科学计算、工程设计、教育研究、商业决策、气候建模、人口统计和社会科学中的应用。
通过探索等高线图的适用范围和局限性,该专栏帮助读者避免误用,充分发挥其潜力。它还强调了等高线图在发现复杂数据模式、支持数据驱动的决策和促进理解和探索方面的作用。
专栏目录
最低0.47元/天 解锁专栏
买1年送3月
百万级
高质量VIP文章无限畅学
千万级
优质资源任意下载
C知道
免费提问 ( 生成式Al产品 )
最新推荐
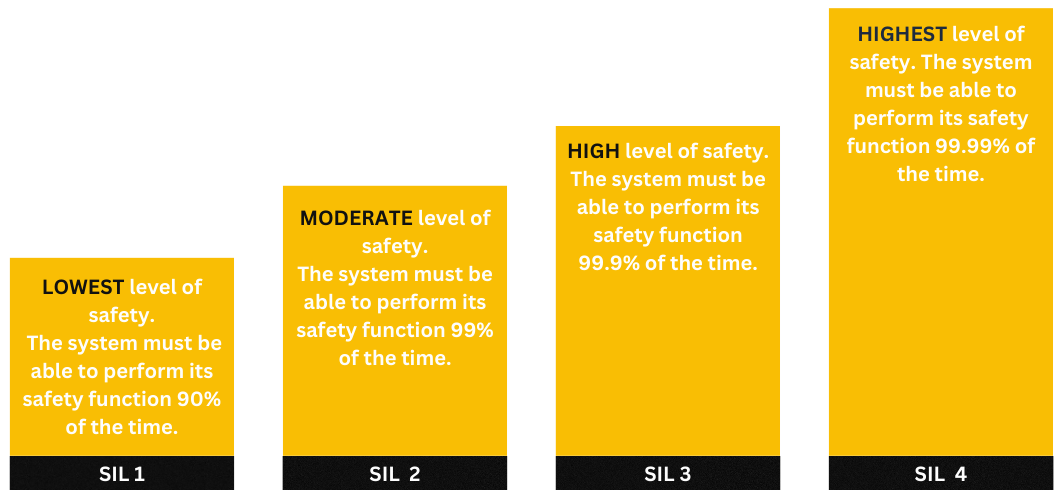
功能安全完整性级别(SIL):从理解到精通应用
# 摘要
功能安全完整性级别(SIL)是衡量系统功能安全性能的关键指标,对于提高系统可靠性、降低风险具有至关重要的作用。本文系统介绍了SIL的基础知识、理论框架及其在不同领域的应用案例,分析了SIL的系统化管理和认证流程,并探讨了技术创新与SIL认证的关系。文章还展望了SIL的创新应用和未来发展趋势,强调了在可持续发展和安全文化推广中SIL的重要性。通过对SIL深入的探讨和分析,本文旨在为相关行业提供参考,促进功
ZTW622在复杂系统中的应用案例与整合策略

# 摘要
ZTW622技术作为一种先进的解决方案,在现代复杂系统中扮演着重要角色。本文全面概述了ZTW622技术及其在ERP、CRM系统以及物联网领域的应用案例,强调了技术整合过程中的挑战和实际操作指南。文章深入探讨了ZTW622的整合策略,包括数据同步、系统安全、性能优化及可扩展性,并提供了实践操作指南。此外,本文还分享了成功案例,分析了整合过程中的挑战和解决方案,最后对ZT
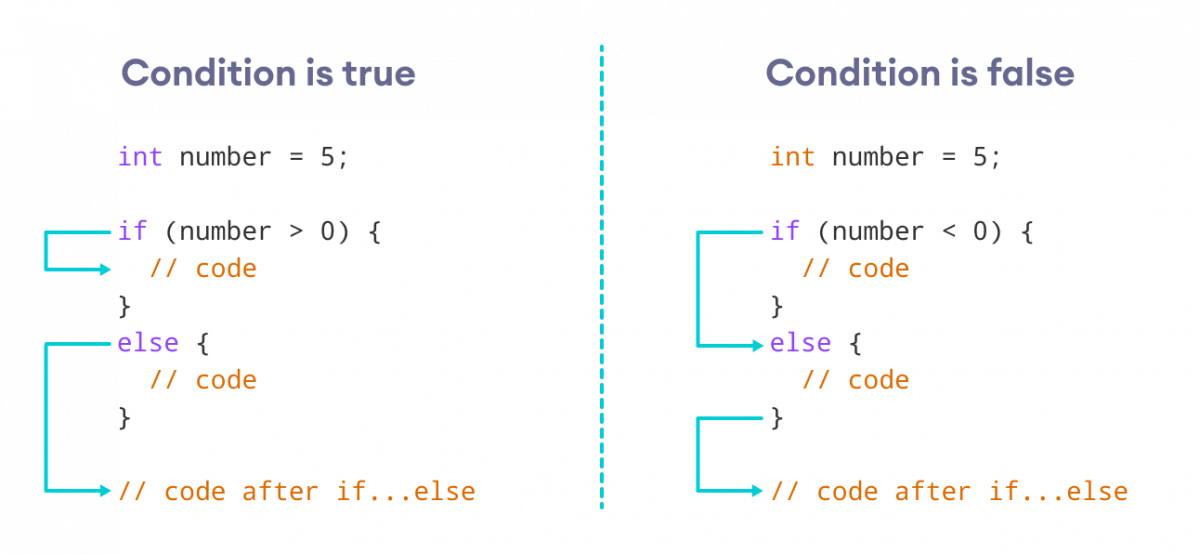
【Python并发编程完全指南】:精通线程与进程的区别及高效应用
# 摘要
本文详细探讨了Python中的并发编程模型,包括线程和进程的基础知识、高级特性和性能优化。文章首先介绍了并发编程的基础概念和Python并发模型,然后深入讲解了线程编程的各个方面,如线程的创建、同步机制、局部存储、线程池的应用以及线程安全和性能调优。之后,转向进程编程,涵盖了进程的基本使用、进程间通信、多进程架构设计和性能监控。此外,还介绍了Python并发框架,如concurrent.futures、as
RS232_RS422_RS485总线规格及应用解析:基础知识介绍

# 摘要
本文详细探讨了RS232、RS422和RS485三种常见的串行通信总线技术,分析了各自的技术规格、应用场景以及优缺点。通过对RS232的电气特性、连接方式和局限性,RS422的信号传输能力与差分特性,以及RS485的多点通信和网络拓扑的详细解析,本文揭示了各总线技术在工业自动化、楼宇自动化和智能设备中的实际应用案例。最后,文章对三种总线技术进行了比较分析,并探讨了总线技术在5G通信和智能技术中的创新
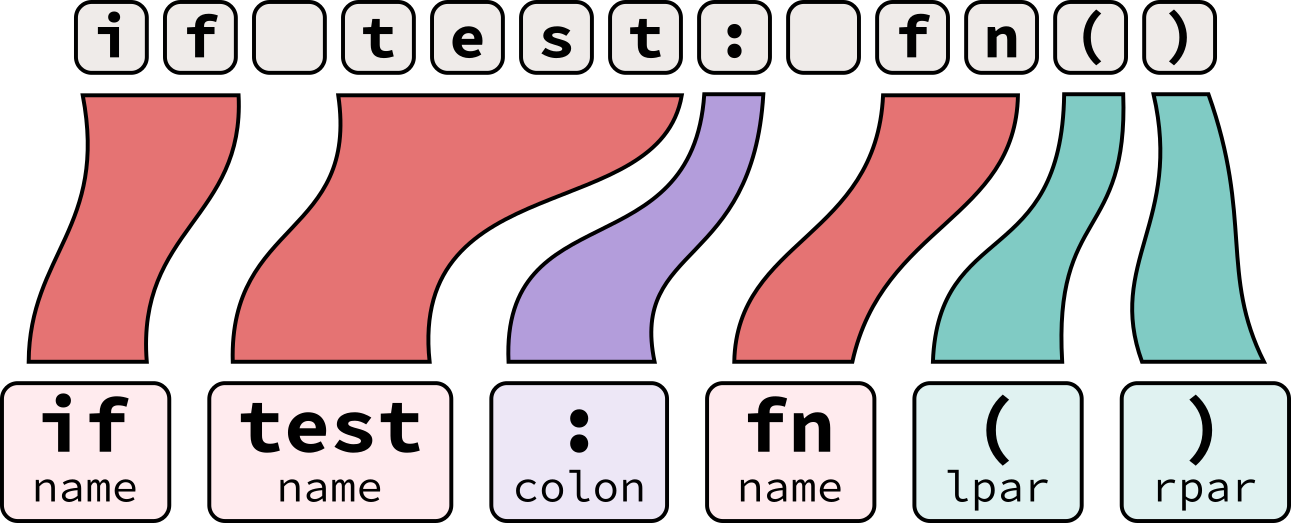
【C-Minus词法分析器构建秘籍】:5步实现前端工程
# 摘要
C-Minus词法分析器是编译器前端的关键组成部分,它将源代码文本转换成一系列的词法单元,为后续的语法分析奠定基础。本文从理论到实践,详细阐述了C-Minus词法分析器的概念、作用和工作原理,并对构建过程中的技术细节和挑战进行了深入探讨。我们分析了C-Minus语言的词法规则、利用正则表达式进行词法分析,并提供了实现C-Minus词法分析
【IBM X3850 X5故障排查宝典】:快速诊断与解决,保障系统稳定运行
# 摘要
本文全面介绍了IBM X3850 X5服务器的硬件构成、故障排查理论、硬件故障诊断技巧、软件与系统级故障排查、故障修复实战案例分析以及系统稳定性保障与维护策略。通过对关键硬件组件和性能指标的了解,阐述了服务器故障排查的理论框架和监控预防方法。此外,文章还提供了硬件故障诊断的具体技巧,包括电源、存储系统、内存和处理器问题处理方法,并对操作系统故障、网络通信故障以及应用层面问题进行了系统性的分析和故障追踪。通过实战案例的复盘,本文总结了故障排查的有效方法,并强调了系统优化、定期维护、持续监控以及故障预防的重要性,为确保企业级服务器的稳定运行提供了详细的技术指导和实用策略。
# 关键字
【TM1668芯片编程艺术】:从新手到高手的进阶之路
# 摘要
本文全面介绍了TM1668芯片的基础知识、编程理论、实践技巧、高级应用案例和编程进阶知识。首先概述了TM1668芯片的应用领域,随后深入探讨了其硬件接口、功能特性以及基础编程指令集。第二章详细论述了编程语言和开发环境的选择,为读者提供了实用的入门和进阶编程实践技巧。第三章通过多个应用项目,展示了如何将TM1668芯片应用于工业控制、智能家居和教育培训等领域。最后一章分析了芯片的高级编程技巧,讨论了性能扩展及未来的技术创新方向,同时指出编程资源与社区支持的重要性。
# 关键字
TM1668芯片;编程理论;实践技巧;应用案例;性能优化;社区支持
参考资源链接:[TM1668:全能LE
【Minitab案例研究】:解决实际数据集问题的专家策略
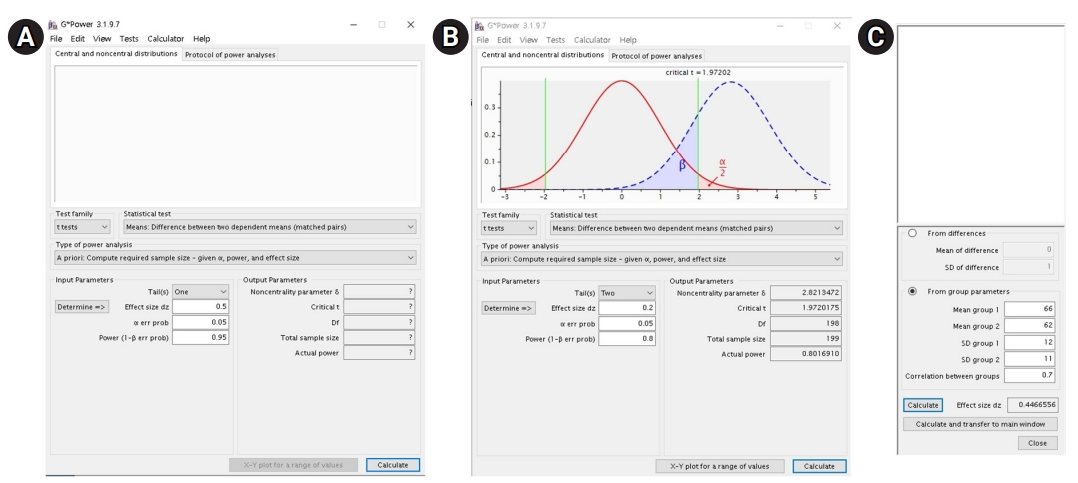
# 摘要
本文全面介绍了Minitab统计软件在数据分析中的应用,包括数据集基础、数据预处理、统计分析方法、高级数据分析技术、实验设计与优化策略,以及数据可视化工具的深入应用。文章首先概述了Minitab的基本功能和数据集的基础知识,接着详细阐述了数据清洗技巧、探索性数据分析、常用统计分析方法以及在Minitab中的具体实现。在高级数据分析技术部分,探讨了多元回归分析和时间序列分析,以及实际案例应用研究。此外,文章还涉及
跨平台开发新境界:MinGW-64与Unix工具的融合秘笈
# 摘要
本文全面探讨了MinGW-64与Unix工具的融合,以及如何利用这一技术进行高效的跨平台开发。文章首先概述了MinGW-64的基础知识和跨平台开发的概念,接着深入介绍了Unix工具在MinGW-64环境下的实践应用,包括移植常用Unix工具、编写跨平台脚本和进行跨平台编译与构建。文章还讨论了高级跨平台工具链配置、性能优化策略以及跨平台问题的诊断与解决方法。通过案例研究,
【单片机编程宝典】:手势识别代码优化的艺术
# 摘要
本文首先概述了手势识别技术的基本概念和应用,接着深入探讨了在单片机平台上的环境搭建和关键算法的实现。文中详细介绍了单片机的选择、开发环境的配置、硬件接口标准、手势信号的采集预处理、特征提取、模式识别技术以及实时性能优化策略。此外,本文还包含了手势识别系统的实践应用案例分析,并对成功案例进行了回顾和问题解决方案的讨论。最后,文章展望了未来手势识别技术的发展趋势,特别是机器学习的应用、多传感器数据融合技术以及新兴技术的
资源上传下载、课程学习等过程中有任何疑问或建议,欢迎提出宝贵意见哦~我们会及时处理!
点击此处反馈


专栏目录
最低0.47元/天 解锁专栏
买1年送3月
百万级
高质量VIP文章无限畅学
千万级
优质资源任意下载
C知道
免费提问 ( 生成式Al产品 )