从金融到医疗:等高线图在不同行业中的应用案例,解锁数据潜能
发布时间: 2024-07-10 00:29:18 阅读量: 53 订阅数: 26 
# 1. 等高线图简介
等高线图是一种可视化工具,用于表示三维表面或函数的二维投影。它通过连接具有相同高度或值的点来创建一系列称为等高线的曲线。等高线图广泛应用于地理、气象、金融和医学等领域,为复杂数据的可视化和分析提供了直观的方式。
# 2. 等高线图的理论基础
### 2.1 等值线和等高线
**等值线**是指在空间中连接具有相同数值的点的曲线。例如,在气象图中,等值线连接具有相同气压的点。
**等高线**是等值线的一种特殊形式,它专门用于表示地表高度。等高线连接具有相同海拔高度的点。
### 2.2 等高线图的绘制原理
等高线图是通过插值绘制的。首先,测量地表上多个点的海拔高度。然后,使用插值算法来估计其他点的海拔高度。最后,连接具有相同海拔高度的点以绘制等高线。
常用的插值算法包括:
* 线性插值
* 最近邻插值
* 克里金插值
### 2.3 等高线图的解读方法
等高线图可以用来了解地表的形状和坡度。
**形状:**等高线的形状可以反映地表的形状。例如,闭合的等高线表示山峰或山谷。
**坡度:**等高线之间的距离可以反映地表的坡度。等高线越密,坡度越大。
**方向:**等高线的走向可以反映地表的坡度方向。等高线垂直于坡度最大的方向。
**代码示例:**
```python
import numpy as np
import matplotlib.pyplot as plt
# 创建一个等高线图
x = np.linspace(-10, 10, 100)
y = np.linspace(-10, 10, 100)
X, Y = np.meshgrid(x, y)
Z = np.sin(X) + np.cos(Y)
plt.contour(X, Y, Z, levels=10)
plt.colorbar()
plt.show()
```
**逻辑分析:**
这段代码使用`numpy`库创建了一个正弦和余弦函数的等高线图。`contour()`函数用于绘制等高线,`levels`参数指定了等高线的数量。`colorbar()`函数添加了一个颜色条,以指示不同等高线对应的值。
**参数说明:**
* `X`:x轴坐标
* `Y`:y轴坐标
* `Z`:z轴坐标(海拔高度)
* `levels`:等高线的数量
# 3. 等高线图在金融领域的应用
### 3.1 股市走势分析
等高线图在股市走势分析中扮演着至关重要的角色,它可以帮助投资者可视化股票价格随时间变化的情况,从而识别趋势、支撑位和阻力位。
**绘制股市等高线图:**
```python
import matplotlib.pyplot as plt
import numpy as np
# 生成股价数据
dates = np.arange(0, 100, 1)
prices = np.random.randn(100) + 50
# 创建等高线图
plt.contourf(dates, prices, prices, cmap='RdYlGn')
plt.colorbar()
plt.xlabel
```

 百万级
高质量VIP文章无限畅学
百万级
高质量VIP文章无限畅学
 千万级
优质资源任意下载
千万级
优质资源任意下载
 C知道
免费提问 ( 生成式Al产品 )
C知道
免费提问 ( 生成式Al产品 )
0
0
相关推荐

专栏简介
等高线图专栏深入探讨了这种强大的数据可视化工具,揭示了其在各个领域的广泛应用。从揭秘等高线图的秘密武器到绘制数据分布的艺术,该专栏提供了全面的指南,帮助读者掌握等高线图的原理和实践。
专栏深入分析了等高线图的优缺点,将其与其他可视化技术进行了比较,指导读者选择合适的工具。它还提供了丰富的行业案例,展示了等高线图在金融、医疗、机器学习、自然语言处理、图像处理、科学计算、工程设计、教育研究、商业决策、气候建模、人口统计和社会科学中的应用。
通过探索等高线图的适用范围和局限性,该专栏帮助读者避免误用,充分发挥其潜力。它还强调了等高线图在发现复杂数据模式、支持数据驱动的决策和促进理解和探索方面的作用。
专栏目录
最低0.47元/天 解锁专栏
买1年送3月
百万级
高质量VIP文章无限畅学
千万级
优质资源任意下载
C知道
免费提问 ( 生成式Al产品 )
最新推荐
【线性回归时间序列预测】:掌握步骤与技巧,预测未来不是梦
# 1. 线性回归时间序列预测概述
## 1.1 预测方法简介
线性回归作为统计学中的一种基础而强大的工具,被广泛应用于时间序列预测。它通过分析变量之间的关系来预测未来的数据点。时间序列预测是指利用历史时间点上的数据来预测未来某个时间点上的数据。
## 1.2 时间序列预测的重要性
在金融分析、库存管理、经济预测等领域,时间序列预测的准确性对于制定战略和决策具有重要意义。线性回归方法因其简单性和解释性,成为这一领域中一个不可或缺的工具。
## 1.3 线性回归模型的适用场景
尽管线性回归在处理非线性关系时存在局限,但在许多情况下,线性模型可以提供足够的准确度,并且计算效率高。本章将介绍线
Pandas数据转换:重塑、融合与数据转换技巧秘籍
# 1. Pandas数据转换基础
在这一章节中,我们将介绍Pandas库中数据转换的基础知识,为读者搭建理解后续章节内容的基础。首先,我们将快速回顾Pandas库的重要性以及它在数据分析中的核心地位。接下来,我们将探讨数据转换的基本概念,包括数据的筛选、清洗、聚合等操作。然后,逐步深入到不同数据转换场景,对每种操作的实际意义进行详细解读,以及它们如何影响数
从Python脚本到交互式图表:Matplotlib的应用案例,让数据生动起来

# 1. Matplotlib的安装与基础配置
在这一章中,我们将首先讨论如何安装Matplotlib,这是一个广泛使用的Python绘图库,它是数据可视化项目中的一个核心工具。我们将介绍适用于各种操作系统的安装方法,并确保读者可以无痛地开始使用Matplotlib
NumPy在金融数据分析中的应用:风险模型与预测技术的6大秘籍

# 1. NumPy基础与金融数据处理
金融数据处理是金融分析的核心,而NumPy作为一个强大的科学计算库,在金融数据处理中扮演着不可或缺的角色。本章首先介绍NumPy的基础知识,然后探讨其在金融数据处理中的应用。
## 1.1 NumPy基础
NumPy(N
【品牌化的可视化效果】:Seaborn样式管理的艺术

# 1. Seaborn概述与数据可视化基础
## 1.1 Seaborn的诞生与重要性
Seaborn是一个基于Python的统计绘图库,它提供了一个高级接口来绘制吸引人的和信息丰富的统计图形。与Matplotlib等绘图库相比,Seaborn在很多方面提供了更为简洁的API,尤其是在绘制具有多个变量的图表时,通过引入额外的主题和调色板功能,大大简化了绘图的过程。Seaborn在数据科学领域得
大样本理论在假设检验中的应用:中心极限定理的力量与实践
# 1. 中心极限定理的理论基础
## 1.1 概率论的开篇
概率论是数学的一个分支,它研究随机事件及其发生的可能性。中心极限定理是概率论中最重要的定理之一,它描述了在一定条件下,大量独立随机变量之和(或平均值)的分布趋向于正态分布的性
数据清洗的概率分布理解:数据背后的分布特性

# 1. 数据清洗的概述和重要性
数据清洗是数据预处理的一个关键环节,它直接关系到数据分析和挖掘的准确性和有效性。在大数据时代,数据清洗的地位尤为重要,因为数据量巨大且复杂性高,清洗过程的优劣可以显著影响最终结果的质量。
## 1.1 数据清洗的目的
数据清洗
Keras注意力机制:构建理解复杂数据的强大模型
# 1. 注意力机制在深度学习中的作用
## 1.1 理解深度学习中的注意力
深度学习通过模仿人脑的信息处理机制,已经取得了巨大的成功。然而,传统深度学习模型在处理长序列数据时常常遇到挑战,如长距离依赖问题和计算资源消耗。注意力机制的提出为解决这些问题提供了一种创新的方法。通过模仿人类的注意力集中过程,这种机制允许模型在处理信息时,更加聚焦于相关数据,从而提高学习效率和准确性。
## 1.2
正态分布与信号处理:噪声模型的正态分布应用解析
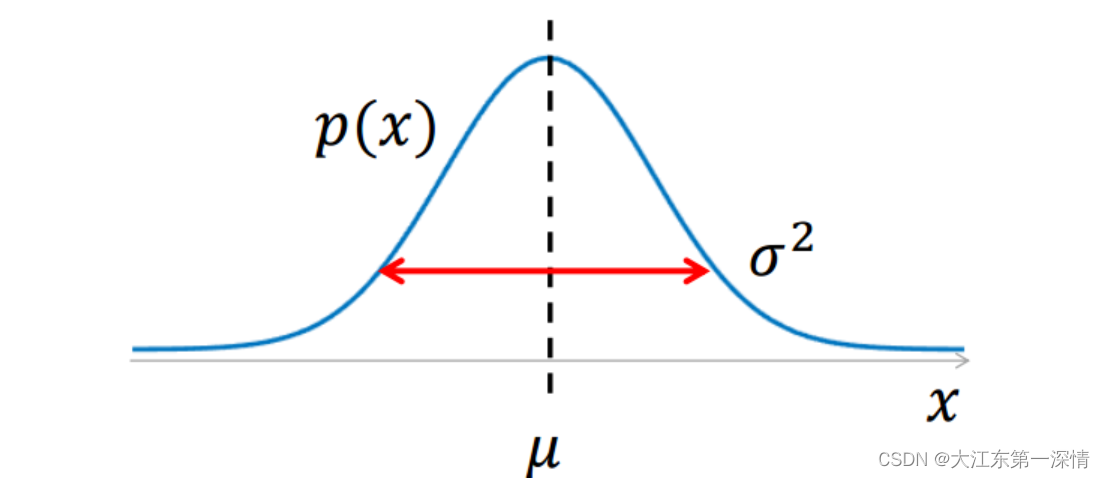
# 1. 正态分布的基础理论
正态分布,又称为高斯分布,是一种在自然界和社会科学中广泛存在的统计分布。其因数学表达形式简洁且具有重要的统计意义而广受关注。本章节我们将从以下几个方面对正态分布的基础理论进行探讨。
## 正态分布的数学定义
正态分布可以用参数均值(μ)和标准差(σ)完全描述,其概率密度函数(PDF)表达式为:
```math
f(x|\mu,\sigma^2) = \frac{1}{\sqrt{2\pi\sigma^2}} e
p值与科学研究诚信:防止P-hacking的重要性
# 1. p值在科学研究中的角色
## 1.1 p值的定义及其重要性
p值是统计学中一个广泛使用的概念,它是在零假设为真的条件下,观察到当前数据或者更极端情况出现的概率。在科学研究中,p值帮助研究者决定是否拒绝零假设,通常p值小于0.05被认为是统计学上显著的。
## 1.2 p值的作用和误解
p值在科学研究中的作用不可忽视,但同时存在误解和滥用的情况。一些研究人员可能过度依赖p值,将其视为效果大
资源上传下载、课程学习等过程中有任何疑问或建议,欢迎提出宝贵意见哦~我们会及时处理!
点击此处反馈


专栏目录
最低0.47元/天 解锁专栏
买1年送3月
百万级
高质量VIP文章无限畅学
千万级
优质资源任意下载
C知道
免费提问 ( 生成式Al产品 )