

The actuarial tables published by insurance companies reflect their statistical analysis of the average life
expectancy of men and women at any given age. From these numbers, the insurance companies then
calculate the appropriate premiums for a particular individual to purchase a given amount of insurance.
Exploratory analysis of data makes use of numerical and graphical techniques to study patterns and
departures from patterns. The widely used descriptive statistical techniques are: Frequency Distribution;
Histograms; Boxplot; Scattergrams and Error Bar plots; and diagnostic plots.
In examining distribution of data, you should be able to detect important characteristics, such as shape,
location, variability, and unusual values. From careful observations of patterns in data, you can generate
conjectures about relationships among variables. The notion of how one variable may be associated with
another permeates almost all of statistics, from simple comparisons of proportions through linear
regression. The difference between association and causation must accompany this conceptual
development.
Data must be collected according to a well-developed plan if valid information on a conjecture is to be
obtained. The plan must identify important variables related to the conjecture, and specify how they are to
be measured. From the data collection plan, a statistical model can be formulated from which inferences
can be drawn.
As an example of statistical modeling with managerial implications, such as "what-if" analysis, consider
regression analysis. Regression analysis is a powerful technique for studying relationship between
dependent variables (i.e., output, performance measure) and independent variables (i.e., inputs, factors,
decision variables). Summarizing relationships among the variables by the most appropriate equation (i.e.,
modeling) allows us to predict or identify the most influential factors and study their impacts on the output
for any changes in their current values.
Frequently, for example the marketing managers are faced with the question, What Sample Size Do I
Need? This is an important and common statistical decision, which should be given due consideration,
since an inadequate sample size invariably leads to wasted resources. The sample size determination
section provides a practical solution to this risky decision.
Statistical models are currently used in various fields of business and science. However, the terminology
differs from field to field. For example, the fitting of models to data, called calibration, history matching,
and data assimilation, are all synonymous with parameter estimation.
Your organization database contains a wealth of information, yet the decision technology group members
tap a fraction of it. Employees waste time scouring multiple sources for a database. The decision-makers
are frustrated because they cannot get business-critical data exactly when they need it. Therefore, too many
decisions are based on guesswork, not facts. Many opportunities are also missed, if they are even noticed at
all.
Knowledge is what we know well. Information is the communication of knowledge. In every knowledge
exchange, there is a sender and a receiver. The sender make common what is private, does the informing,
the communicating. Information can be classified as explicit and tacit forms. The explicit information can
be explained in structured form, while tacit information is inconsistent and fuzzy to explain. Know that data
are only crude information and not knowledge by themselves.
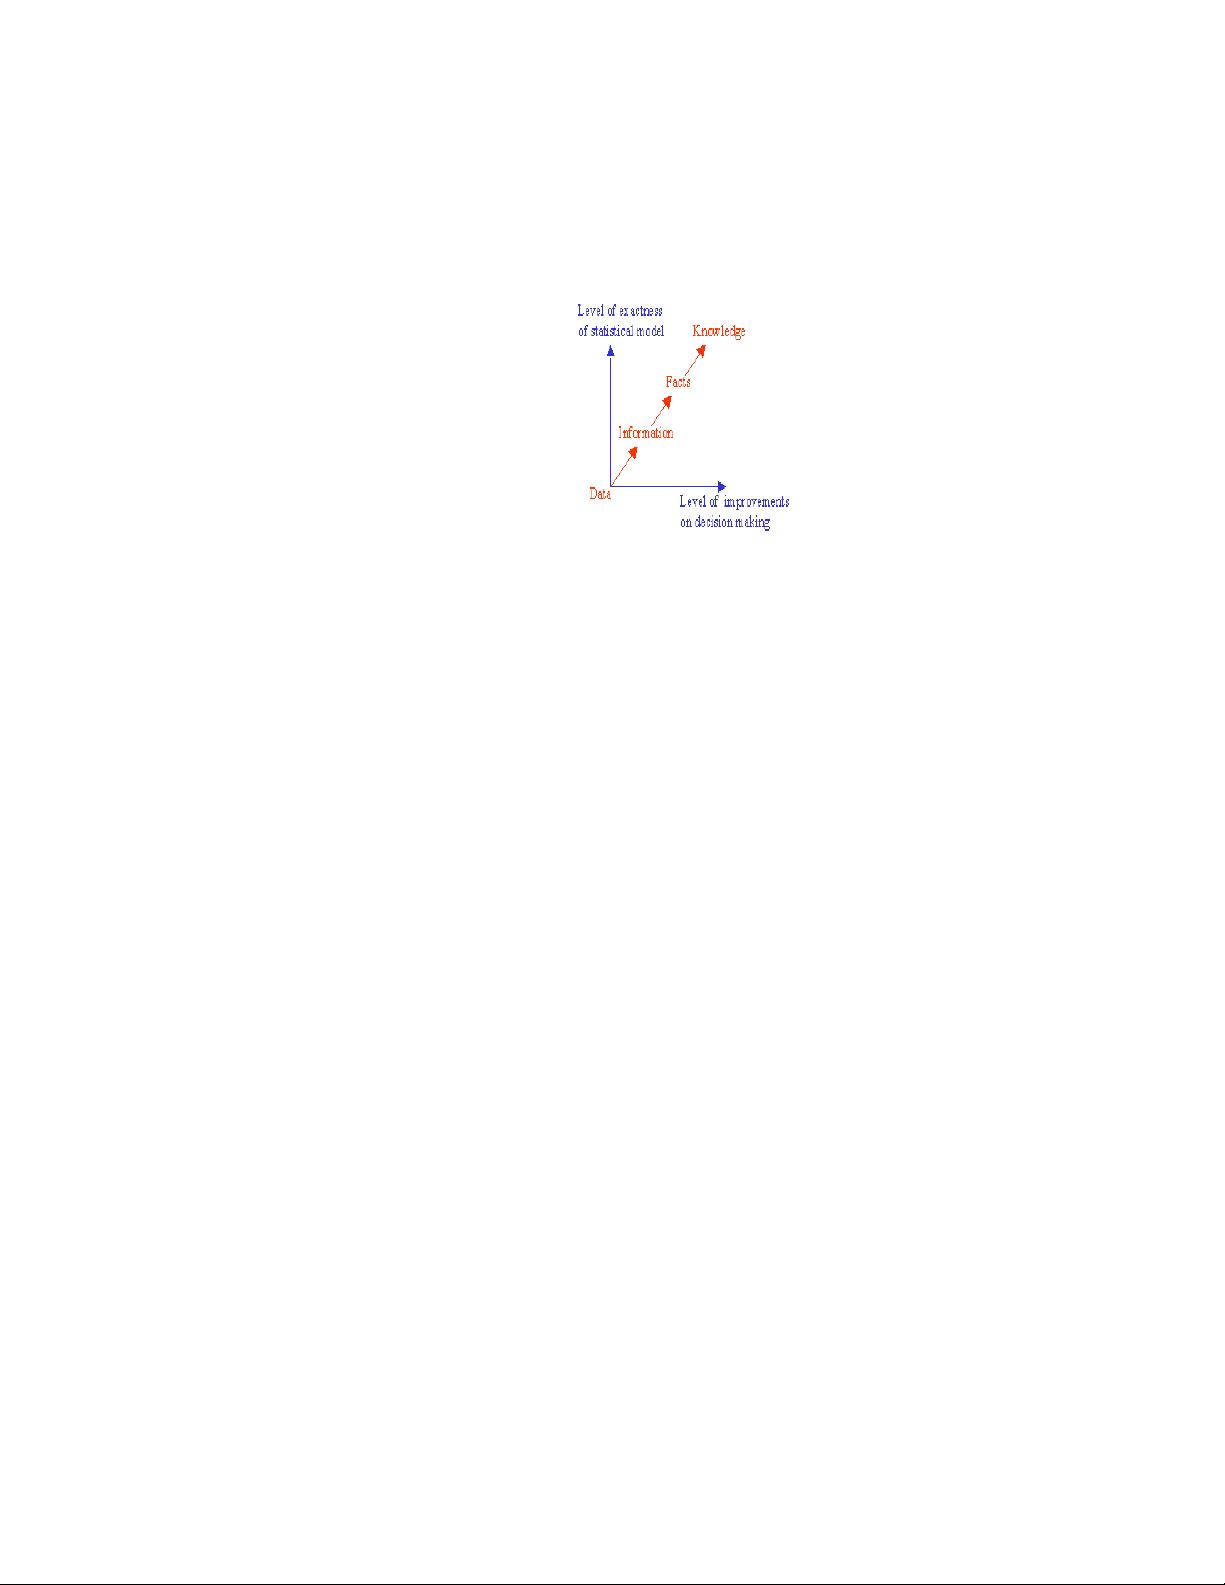
Data is known to be crude information and not knowledge by itself. The sequence from data to knowledge
is: from Data to Information, from Information to Facts, and finally, from Facts to Knowledge. Data
becomes information, when it becomes relevant to your decision problem. Information becomes fact, when
the data can support it. Facts are what the data reveals. However the decisive instrumental (i.e., applied)
knowledge is expressed together with some statistical degree of confidence.

剩余63页未读,继续阅读

casablinca
- 粉丝: 2
- 资源: 3
 我的内容管理
展开
我的内容管理
展开


最新资源
- 十种常见电感线圈电感量计算公式详解
- 军用车辆:CAN总线的集成与优势
- CAN总线在汽车智能换档系统中的作用与实现
- CAN总线数据超载问题及解决策略
- 汽车车身系统CAN总线设计与应用
- SAP企业需求深度剖析:财务会计与供应链的关键流程与改进策略
- CAN总线在发动机电控系统中的通信设计实践
- Spring与iBATIS整合:快速开发与比较分析
- CAN总线驱动的整车管理系统硬件设计详解
- CAN总线通讯智能节点设计与实现
- DSP实现电动汽车CAN总线通讯技术
- CAN协议网关设计:自动位速率检测与互连
- Xcode免证书调试iPad程序开发指南
- 分布式数据库查询优化算法探讨
- Win7安装VC++6.0完全指南:解决兼容性与Office冲突
- MFC实现学生信息管理系统:登录与数据库操作
资源上传下载、课程学习等过程中有任何疑问或建议,欢迎提出宝贵意见哦~我们会及时处理!
点击此处反馈


