
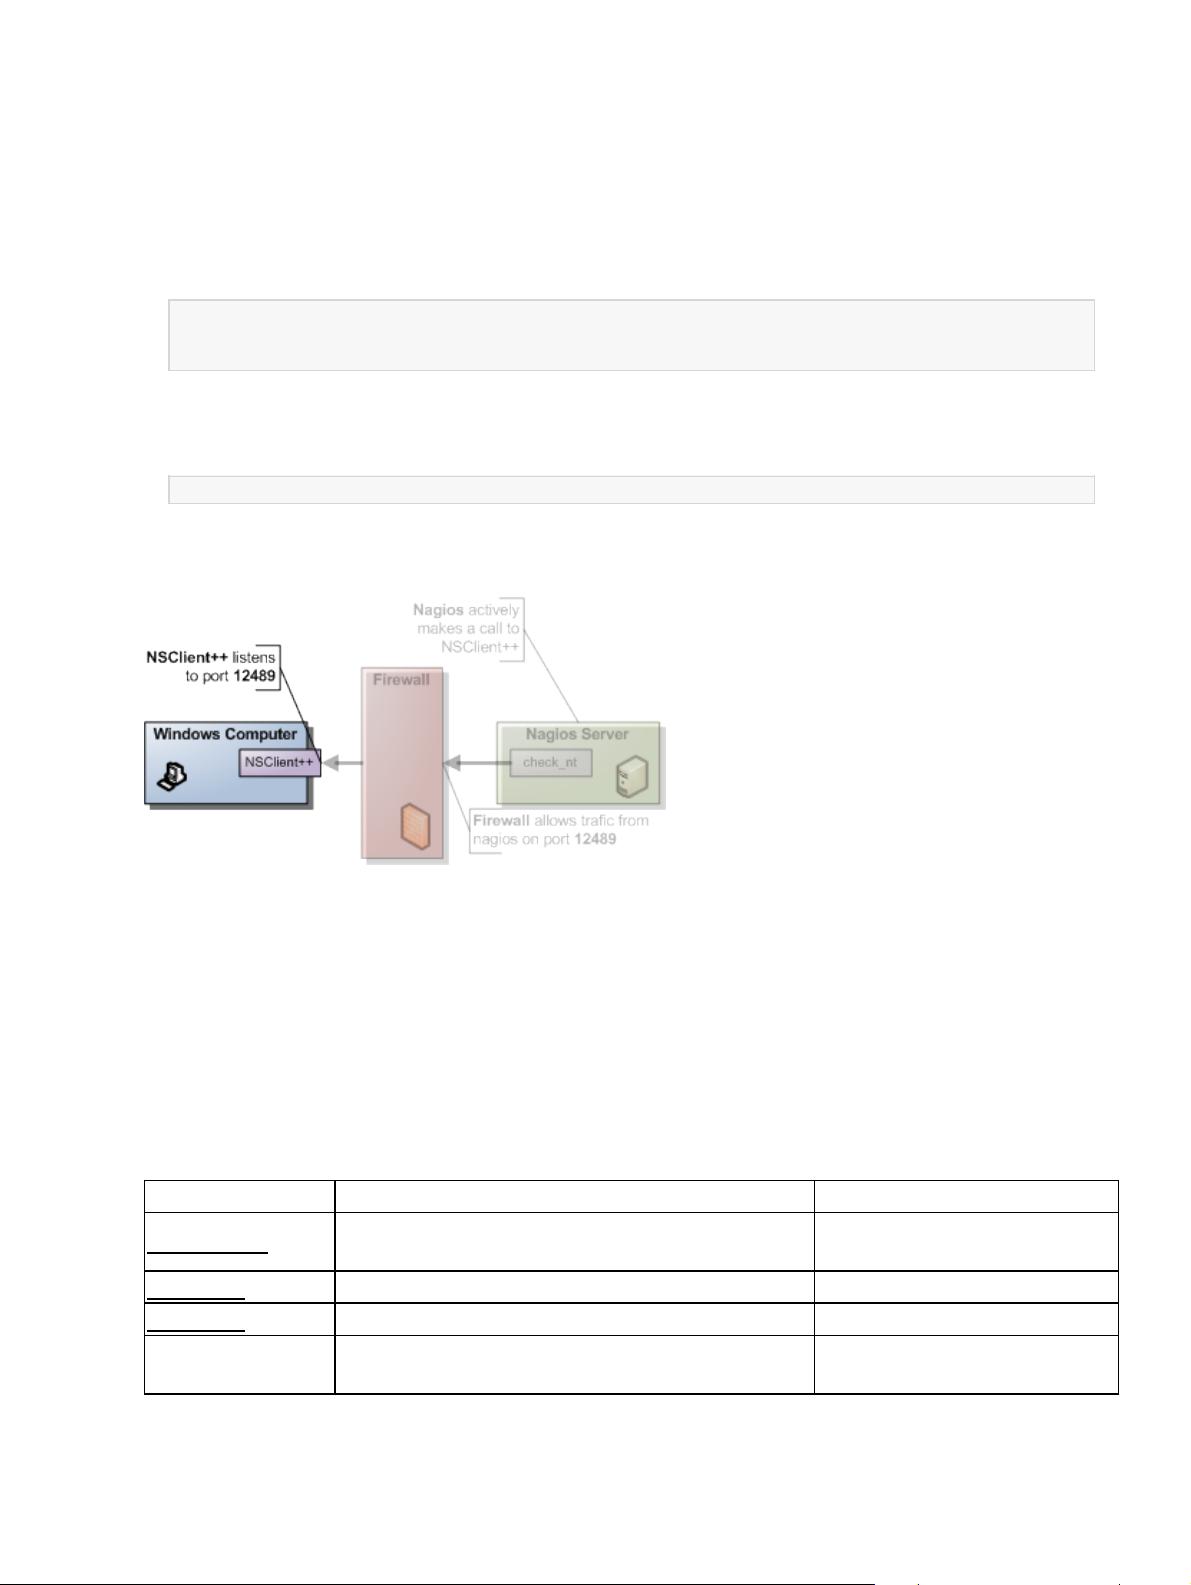
port = the port you are using for the NSClientListener (defaults to 12489)•
command = is the various things you can monitor. The various commands all take different additional
arguments which are all showed in the help.
•
To check the CPU load you can for instance run the following (assuming your windows server has 10.0.0.1 as
ip address)
check_nt -H 10.0.0.1 -p 12489 -v CPULOAD -w 80 -c 90 -l 5,80,90,10,80,90
CPU Load 0% (5 min average) 0% (10 min average)
|'5 min avg Load'=0%;80;90;0;100 '10 min avg Load'=0%;80;90;0;100
If you instead got the following don't worry, it is because your NSClient++ is not configured properly and, we
will solve that in the next section.
CRITICAL - Socket timeout after 10 seconds
2. NSClient++ configuration
The first thing you need to do is decide which modules you want to use. NSClient++ is modular by design this
means you only use the features you want (and if you want you can use all of them). The modules can be
roughly divided into two kinds.
check commands1.
protocols (and utility modules).2.
The first kind is the one you *use* it responds to your commands and "finds" monitored data for you. The
second kind is the one that allows you to talk to the first kind. When it comes to modules for the NSClient
mode you will need the following:
Module Description Commands
CheckSystem.dll Handles many system checks
CPU, MEMORY, COUNTER
etc
CheckDisk.dll Handles Disk related checks USEDDISKSPACE
FileLogger.dll Logs errors to a file so you can see what is going on N/A
NSClientListener.dll
Listens and responds to incoming requests from
nagios
N/A
To enable modules you edit the [modules] section in the nsc.ini file and your section should look something
like this:
1. Nagios command line 5
剩余28页未读,继续阅读

BinXiao
- 粉丝: 24
- 资源: 10
 我的内容管理
展开
我的内容管理
展开


最新资源
- 多模态联合稀疏表示在视频目标跟踪中的应用
- Kubernetes资源管控与Gardener开源软件实践解析
- MPI集群监控与负载平衡策略
- 自动化PHP安全漏洞检测:静态代码分析与数据流方法
- 青苔数据CEO程永:技术生态与阿里云开放创新
- 制造业转型: HyperX引领企业上云策略
- 赵维五分享:航空工业电子采购上云实战与运维策略
- 单片机控制的LED点阵显示屏设计及其实现
- 驻云科技李俊涛:AI驱动的云上服务新趋势与挑战
- 6LoWPAN物联网边界路由器:设计与实现
- 猩便利工程师仲小玉:Terraform云资源管理最佳实践与团队协作
- 类差分度改进的互信息特征选择提升文本分类性能
- VERITAS与阿里云合作的混合云转型与数据保护方案
- 云制造中的生产线仿真模型设计与虚拟化研究
- 汪洋在PostgresChina2018分享:高可用 PostgreSQL 工具与架构设计
- 2018 PostgresChina大会:阿里云时空引擎Ganos在PostgreSQL中的创新应用与多模型存储
资源上传下载、课程学习等过程中有任何疑问或建议,欢迎提出宝贵意见哦~我们会及时处理!
点击此处反馈


