
+++++ took 9.99999 msecs for Outlier scoring
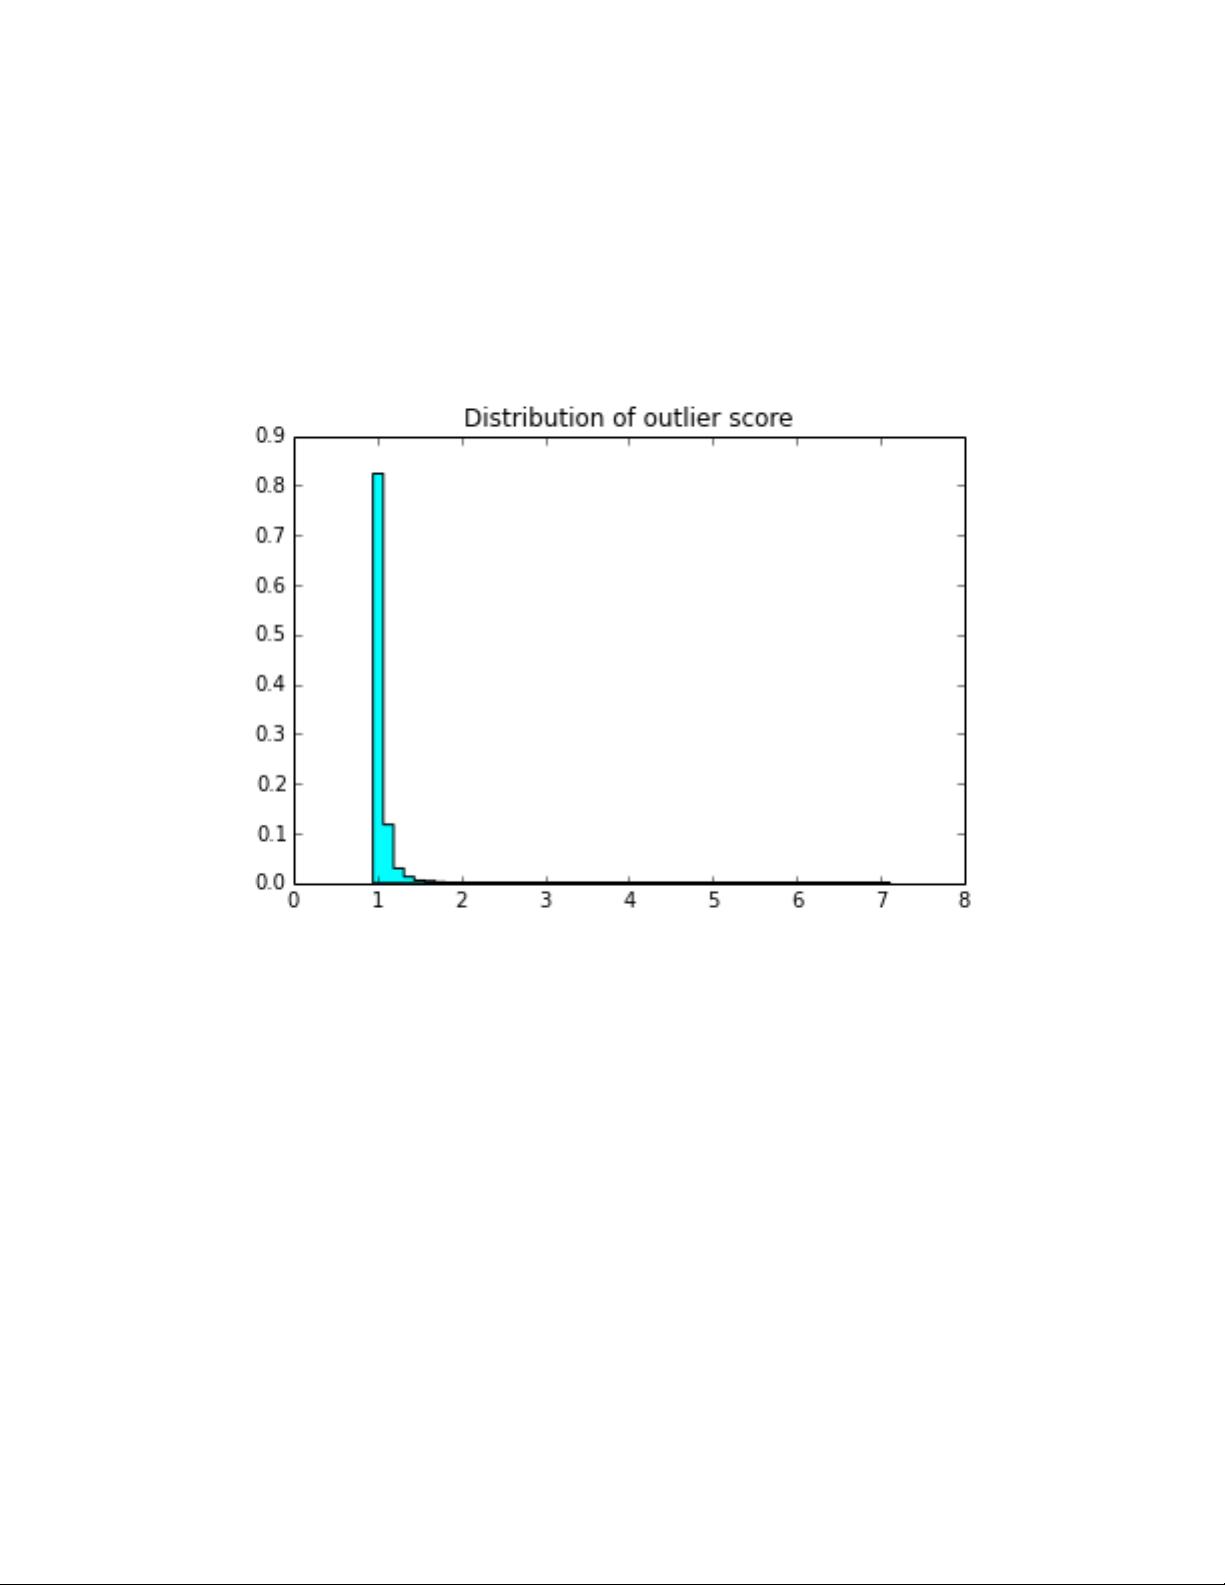
Now lets se the histogram of Outlier score, to choose the optimal threshold to decid weather a data-point
is outlier is not.
In [235]: weights = np.ones_like(outlier_score)/outlier_score.shape[0] # to normalize the histogram to probability plot
hist(outlier_score, bins = 50, weights = weights, histtype = ’stepfilled’, color = ’cyan’)
title(’Distribution of outlier score’)
Out[235]: <matplotlib.text.Text at 0x36030588>
It can be observd that, the optimal outlier score threshold to decide weather a data-point is outlier is
outlier or not is around 2 for most of the cases, so lets use it to see our sesults.
In [236]: threshold = 2.
# plot non outliers as green
scatter(data[:, 0], data[:, 1], c = ’green’, s = 10, edgecolors=’None’, alpha=0.5)
# find the outliers and plot te outliers
idx = np.where(outlier_score > threshold)
scatter(data[idx, 0], data[idx, 1], c = ’red’, s = 10, edgecolors=’None’, alpha=0.5)
Out[236]: <matplotlib.collections.PathCollection at 0x3640e6a0>
3
剩余10页未读,继续阅读

chaosimpler
- 粉丝: 0
- 资源: 4
 我的内容管理
收起
我的内容管理
收起
- 我的资源
快来上传第一个资源
 我的收益 登录查看自己的收益
 我的积分
登录查看自己的积分
我的积分
登录查看自己的积分
 我的C币
登录后查看C币余额
我的C币
登录后查看C币余额
 我的收藏
我的收藏  我的下载
我的下载  下载帮助
下载帮助

会员权益专享


最新资源
- 利用迪杰斯特拉算法的全国交通咨询系统设计与实现
- 全国交通咨询系统C++实现源码解析
- DFT与FFT应用:信号频谱分析实验
- MATLAB图论算法实现:最小费用最大流
- MATLAB常用命令完全指南
- 共创智慧灯杆数据运营公司——抢占5G市场
- 中山农情统计分析系统项目实施与管理策略
- XX省中小学智慧校园建设实施方案
- 中山农情统计分析系统项目实施方案
- MATLAB函数详解:从Text到Size的实用指南
- 考虑速度与加速度限制的工业机器人轨迹规划与实时补偿算法
- Matlab进行统计回归分析:从单因素到双因素方差分析
- 智慧灯杆数据运营公司策划书:抢占5G市场,打造智慧城市新载体
- Photoshop基础与色彩知识:信息时代的PS认证考试全攻略
- Photoshop技能测试:核心概念与操作
- Photoshop试题与答案详解
资源上传下载、课程学习等过程中有任何疑问或建议,欢迎提出宝贵意见哦~我们会及时处理!
点击此处反馈


