
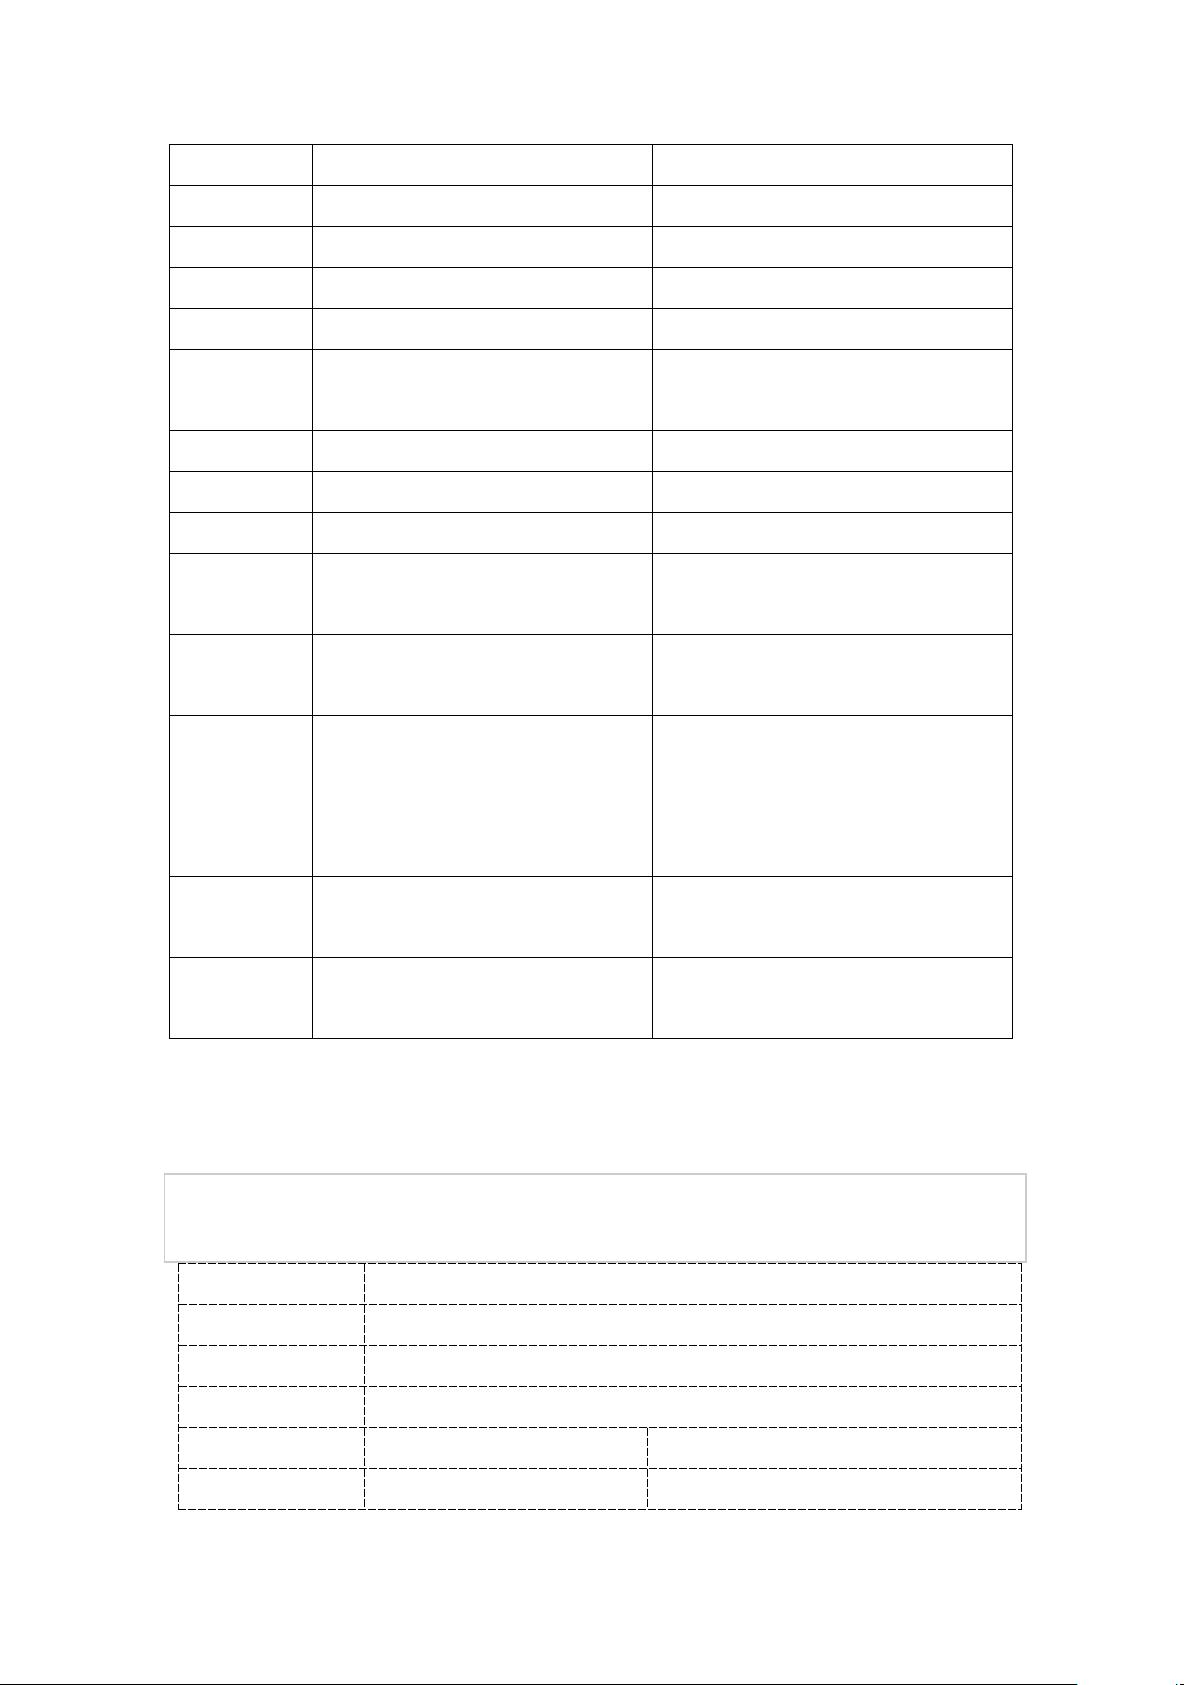
height :
标量或数组
bar 高度
width :
标量或数组
bar 宽度
bottom :
标量或数组,可选,默认为 None
bar 的底部高度
color :
色彩、标量或数组,可选
bar 内部颜色
edgecolor :
色彩、标量或数组,可选
bar 边缘颜色
linewidth :
标量或数组,可选,默认为 None
bar 边缘宽度,若为 None,取默认
宽度;若为 0,则无边缘
xerr :
标量或数组,可选,默认为 None
若不为 None,将生成 errorbar(s)
yerr :
标量或数组,可选,默认为 None
若不为 None,将生成 errorbar(s)
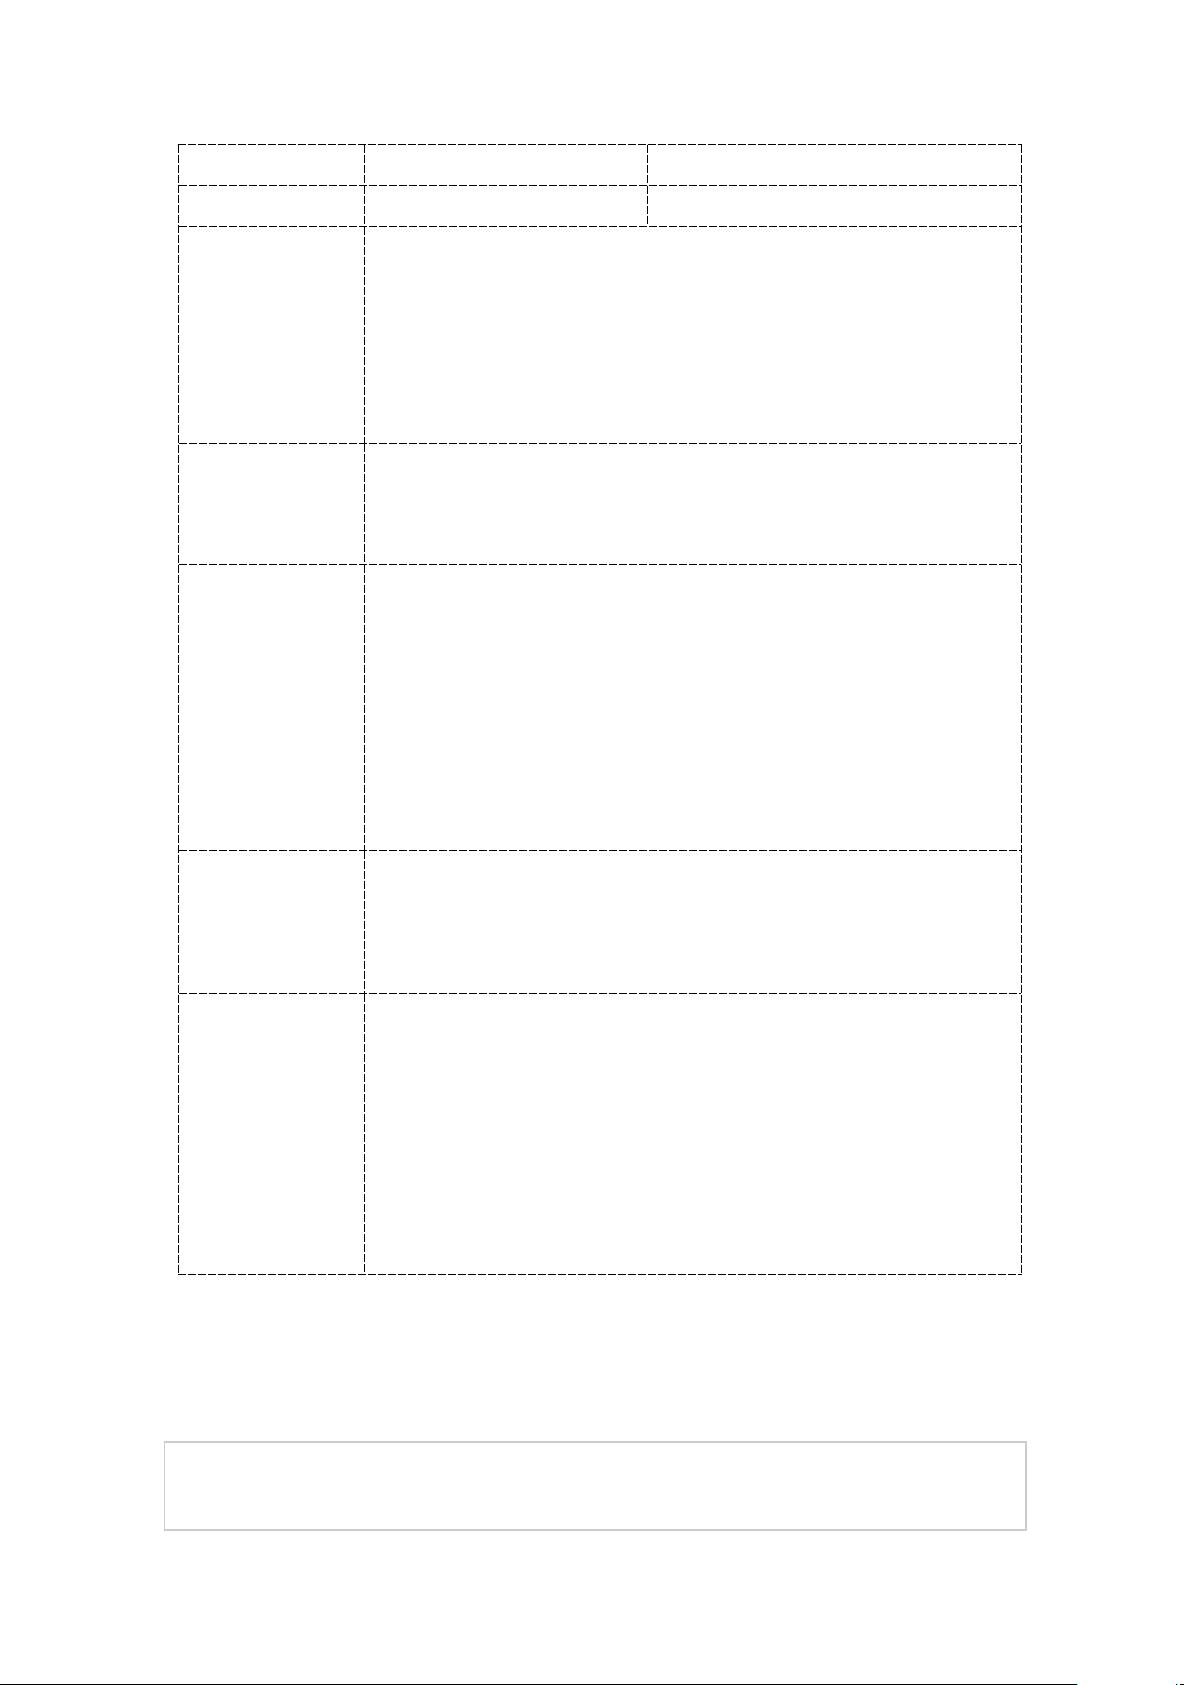
ecolor :
标量或数组,可选,默认为 None
指定 errorbar(s)的颜色
capsize :
整数,可选,默认值:3
指定 errorbar(s)的 cap(帽子)的长
度
error_kw :
字典
errorbar 字典,ecolor 和 capsize 可
在此指定,而不作为独立参量
align :
[‘edge’ | ‘center’],可选, 默认: ‘edge’
若为‘edge’,对于竖条形图,按 bar 左
边缘排列;对于横条形图,按 bar 下
边缘排列。若为'center',把左端的
参数作为 bar 的中心坐标。
orientation :
‘vertical’ | ‘horizontal’,可选, 默认:
‘vertical’
选择竖条形图、横条形图
log :
True、False(0、1),可选,默
认为 False
如果为 True,为对数轴
返回:class(类别):`matplotlib.patches.Rectangle`实例。
其他可选参量,参见matplotlib.patches.Polygon 实例(完全一致)。
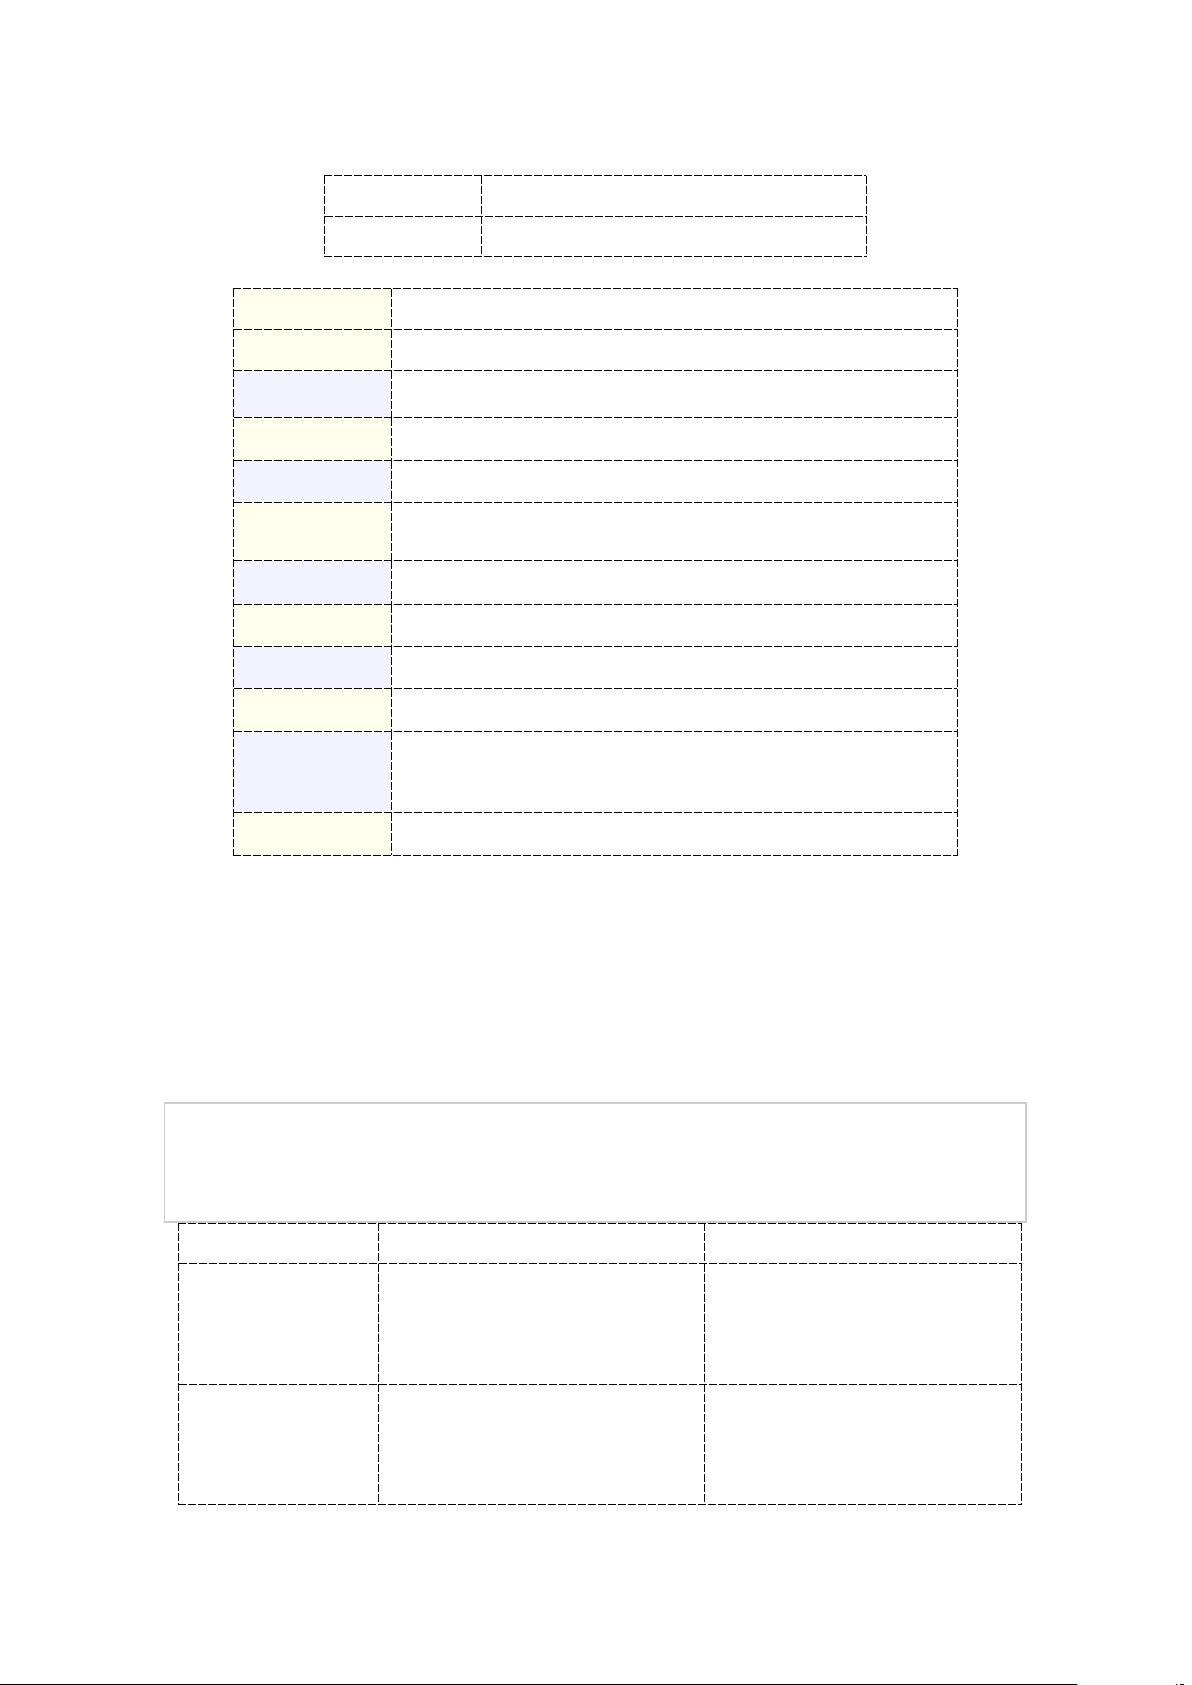
13. matplotlib.pyplot.barbs(*args, **kw)
绘制二维风向杆
barb(X, Y, U, V, C, **kw)
X, Y:
风向杆的坐标位置,默认为 barb 的头部
U, V:
风向的 x、y 方向分量
C:
风向杆颜色
length:
风向杆长度,默认为 9
pivot(支点):
[ ‘tip’ | ‘middle’ ]默认‘tip’
风向杆围绕着指定点旋转
barbcolor:
[ color | color 序列、数组 ]
指定除了 flags 部分之外的颜色,会覆
剩余76页未读,继续阅读

weixin_43935635
- 粉丝: 0
- 资源: 1
 我的内容管理
收起
我的内容管理
收起
- 我的资源
快来上传第一个资源
 我的收益 登录查看自己的收益
 我的积分
登录查看自己的积分
我的积分
登录查看自己的积分
 我的C币
登录后查看C币余额
我的C币
登录后查看C币余额
 我的收藏
我的收藏  我的下载
我的下载  下载帮助
下载帮助

会员权益专享


最新资源
- 京瓷TASKalfa系列维修手册:安全与操作指南
- 小波变换在视频压缩中的应用
- Microsoft OfficeXP详解:WordXP、ExcelXP和PowerPointXP
- 雀巢在线媒介投放策划:门户网站与广告效果分析
- 用友NC-V56供应链功能升级详解(84页)
- 计算机病毒与防御策略探索
- 企业网NAT技术实践:2022年部署互联网出口策略
- 软件测试面试必备:概念、原则与常见问题解析
- 2022年Windows IIS服务器内外网配置详解与Serv-U FTP服务器安装
- 中国联通:企业级ICT转型与创新实践
- C#图形图像编程深入解析:GDI+与多媒体应用
- Xilinx AXI Interconnect v2.1用户指南
- DIY编程电缆全攻略:接口类型与自制指南
- 电脑维护与硬盘数据恢复指南
- 计算机网络技术专业剖析:人才培养与改革
- 量化多因子指数增强策略:微观视角的实证分析
资源上传下载、课程学习等过程中有任何疑问或建议,欢迎提出宝贵意见哦~我们会及时处理!
点击此处反馈


