HDevelop 11.0交互式开发环境用户指南
需积分: 10 80 浏览量
更新于2024-07-20
收藏 9.5MB PDF 举报
HDevelop用户指南是一份详尽的文档,专门针对HDevelop,这是HALCON交互式开发环境的一个版本系列。自1997年首次发布以来,HDevelop经历了多次迭代,从最初的1.0版到最新的11.0版本,反映了HALCON软件的持续发展和完善。这个用户手册涵盖了从早期版本的Halcon 5.1到Halcon 11.0的各个阶段,对于理解和操作Halcon的机器视觉软件至关重要。
HDevelop作为一个开发工具,旨在帮助用户高效地创建、调试和维护基于HALCON的自动化解决方案。它提供了直观的图形界面,使得非编程背景的工程师也能方便地设计复杂的机器视觉应用。随着每一代版本的更新,HDevelop的功能不断增强,包括但不限于代码编辑器、脚本执行、模块管理、调试工具以及与HALCON库的深度集成。
在HDevelop 11.0版本中,可能包含了许多新的特性和改进,例如高级编程功能、性能优化、用户界面的友好性提升,以及对新一代硬件的支持。此外,这份指南还可能包括了最佳实践、API参考、示例代码和故障排除策略,帮助用户解决在开发过程中遇到的问题。
版权信息表明,所有关于HDevelop的复制、存储、检索或任何形式的传输都需要事先获得出版商的书面许可,这体现了对知识产权的尊重和保护。HDevelop用户指南作为官方文档,其内容权威且严谨,是Halcon用户学习和工作的必备参考资料。
HDevelop用户指南是每个想要利用HALCON进行机器视觉开发的工程师的宝贵资源,无论是初学者还是经验丰富的开发者,都可以从中找到所需的信息,不断优化和提升他们的自动化项目。随着HALCON技术的演进,HDevelop用户指南也将不断更新,以适应新的技术和需求。
16 Getting Started
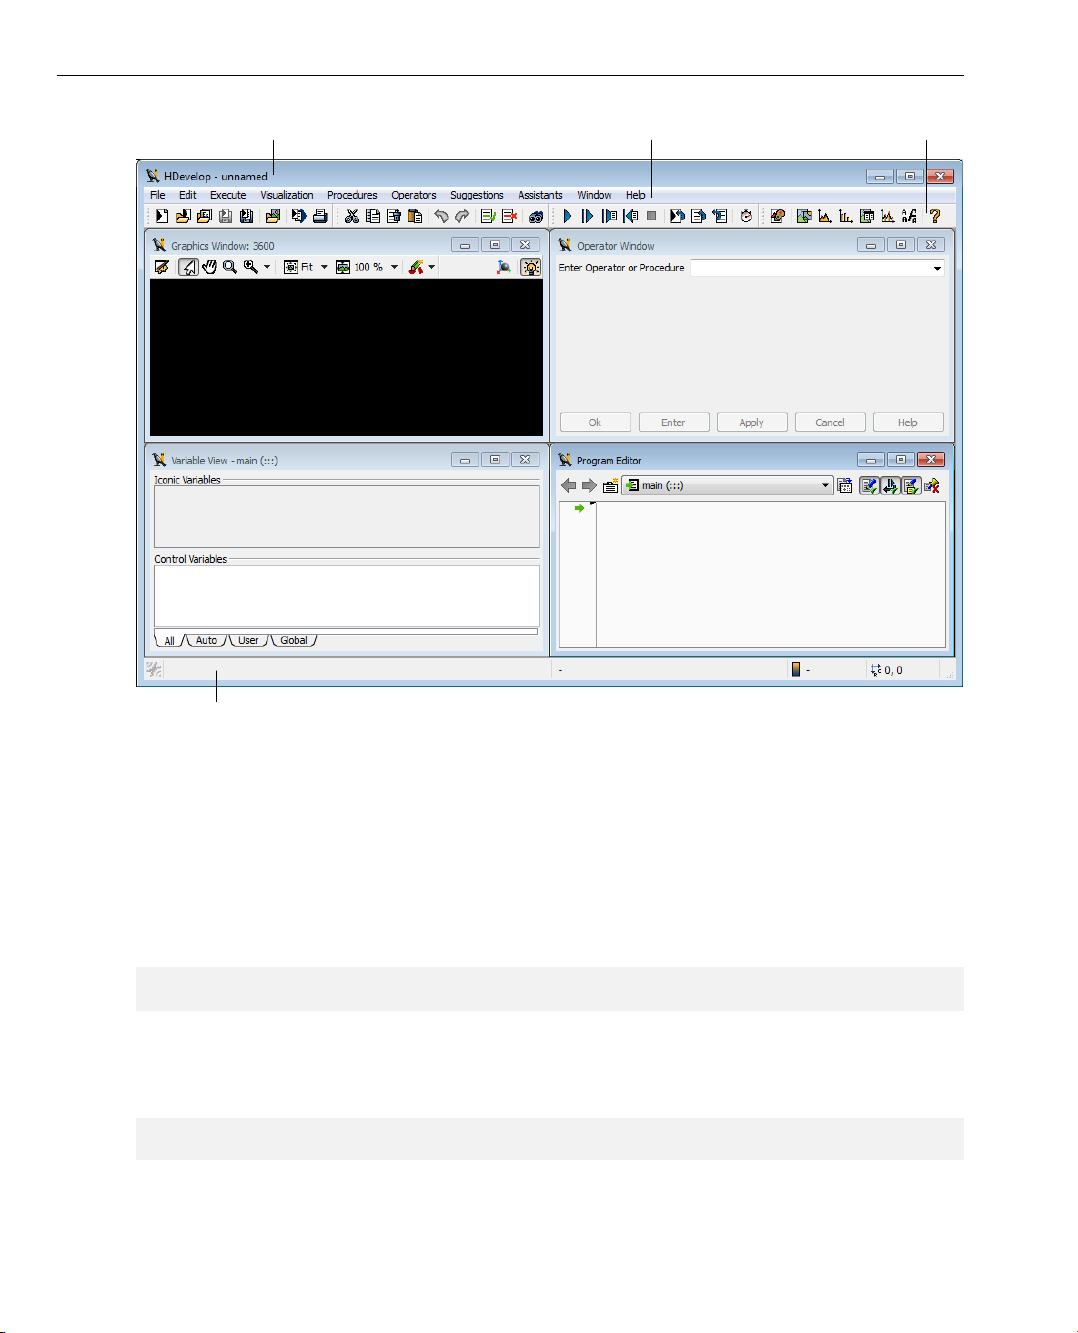
1. graphics window 2. operator window
4. variable window 3. program window
menuwindow title tool bar
status bar
Figure 2.1: User interface.
Command Line Switches
HDevelop supports several command line switches to modify its startup behavior. You can also
add the path and file name of an HDevelop program on the command line to load it directly. This
is identical to an invocation of HDevelop without any parameters and a subsequent loading of
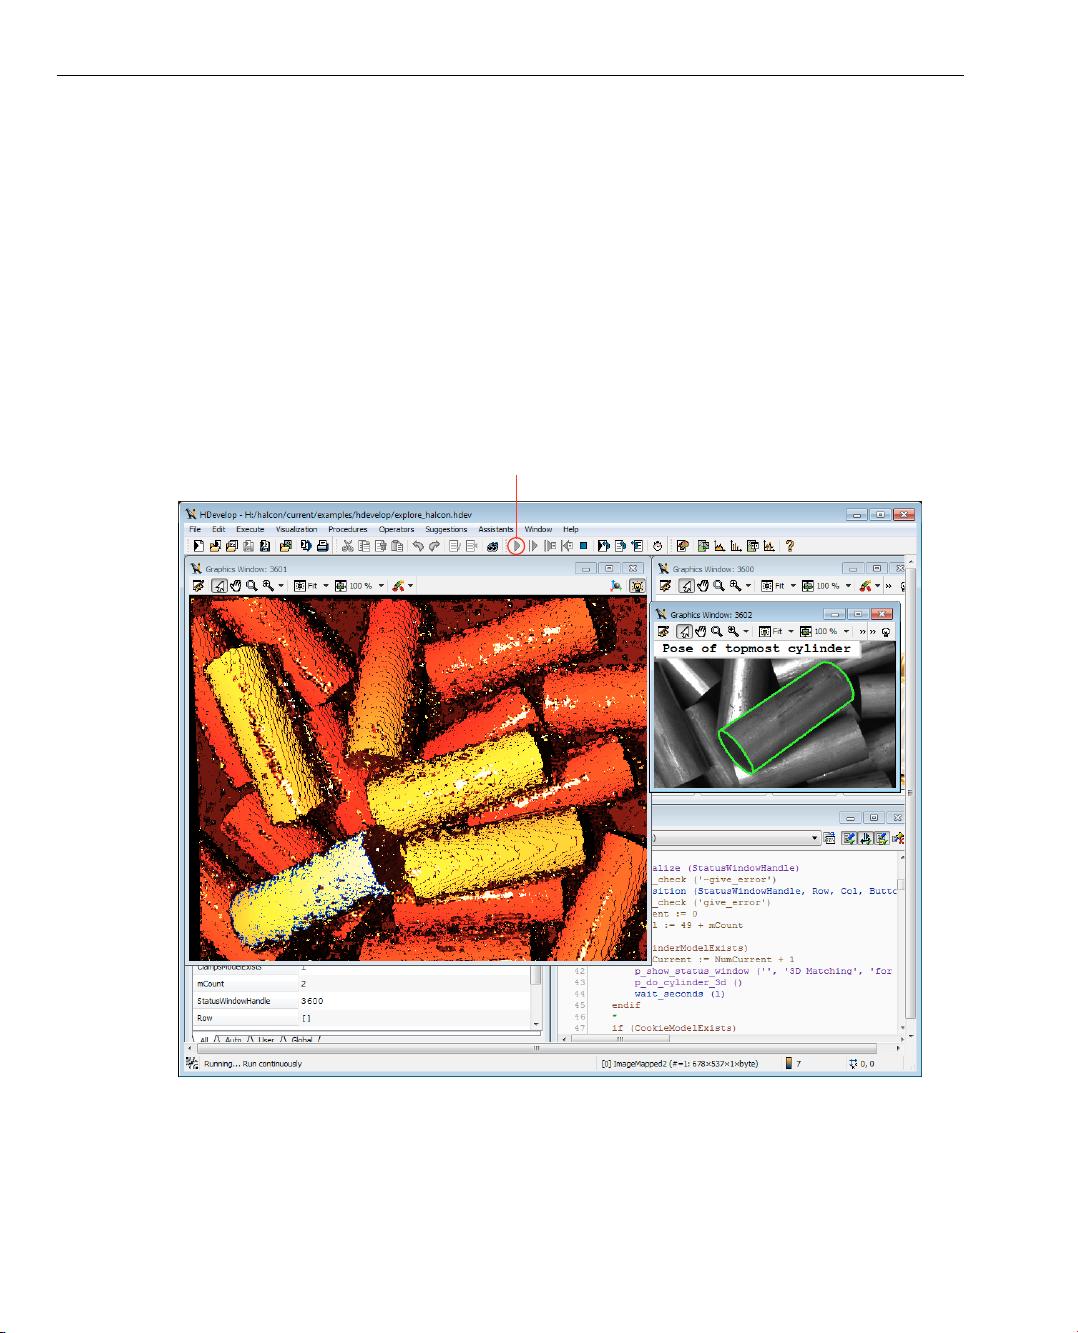
the program. The program name may contain environment variables in Windows syntax as in:
hdevelop %HALCONEXAMPLES%/hdevelop/explore_halcon.hdev
Or, you can convert HDevelop programs to other programming languages without opening the graphical
user interface at all. A full list of the supported command line switches is available with the following
command:
hdevelop --help
See appendix B on page 407 for a listing of the available switches, and some example uses of the
command line.


剩余422页未读,继续阅读
2023-06-09 上传
2023-05-24 上传
2023-05-19 上传
2023-07-28 上传
2023-07-12 上传
2023-06-08 上传

liang890319
- 粉丝: 1163
- 资源: 38
 我的内容管理
展开
我的内容管理
展开


最新资源
- 构建Cadence PSpice仿真模型库教程
- VMware 10.0安装指南:步骤详解与网络、文件共享解决方案
- 中国互联网20周年必读:影响行业的100本经典书籍
- SQL Server 2000 Analysis Services的经典MDX查询示例
- VC6.0 MFC操作Excel教程:亲测Win7下的应用与保存技巧
- 使用Python NetworkX处理网络图
- 科技驱动:计算机控制技术的革新与应用
- MF-1型机器人硬件与robobasic编程详解
- ADC性能指标解析:超越位数、SNR和谐波
- 通用示波器改造为逻辑分析仪:0-1字符显示与电路设计
- C++实现TCP控制台客户端
- SOA架构下ESB在卷烟厂的信息整合与决策支持
- 三维人脸识别:技术进展与应用解析
- 单张人脸图像的眼镜边框自动去除方法
- C语言绘制图形:余弦曲线与正弦函数示例
- Matlab 文件操作入门:fopen、fclose、fprintf、fscanf 等函数使用详解
