
considerably reduced the cases for which we observed mode collapsing. Although TTUR ensures
that the discriminator converges during learning, practicable learning rates must be found for each
experiment. We face a trade-off since the learning rates should be small enough (e.g. for the generator)
to ensure convergence but at the same time should be large enough to allow fast learning. For each of
the experiments, the learning rates have been optimized to be large while still ensuring stable training
which is indicated by a decreasing FID or Jensen-Shannon-divergence (JSD). We further fixed the
time point for stopping training to the update step when the FID or Jensen-Shannon-divergence of
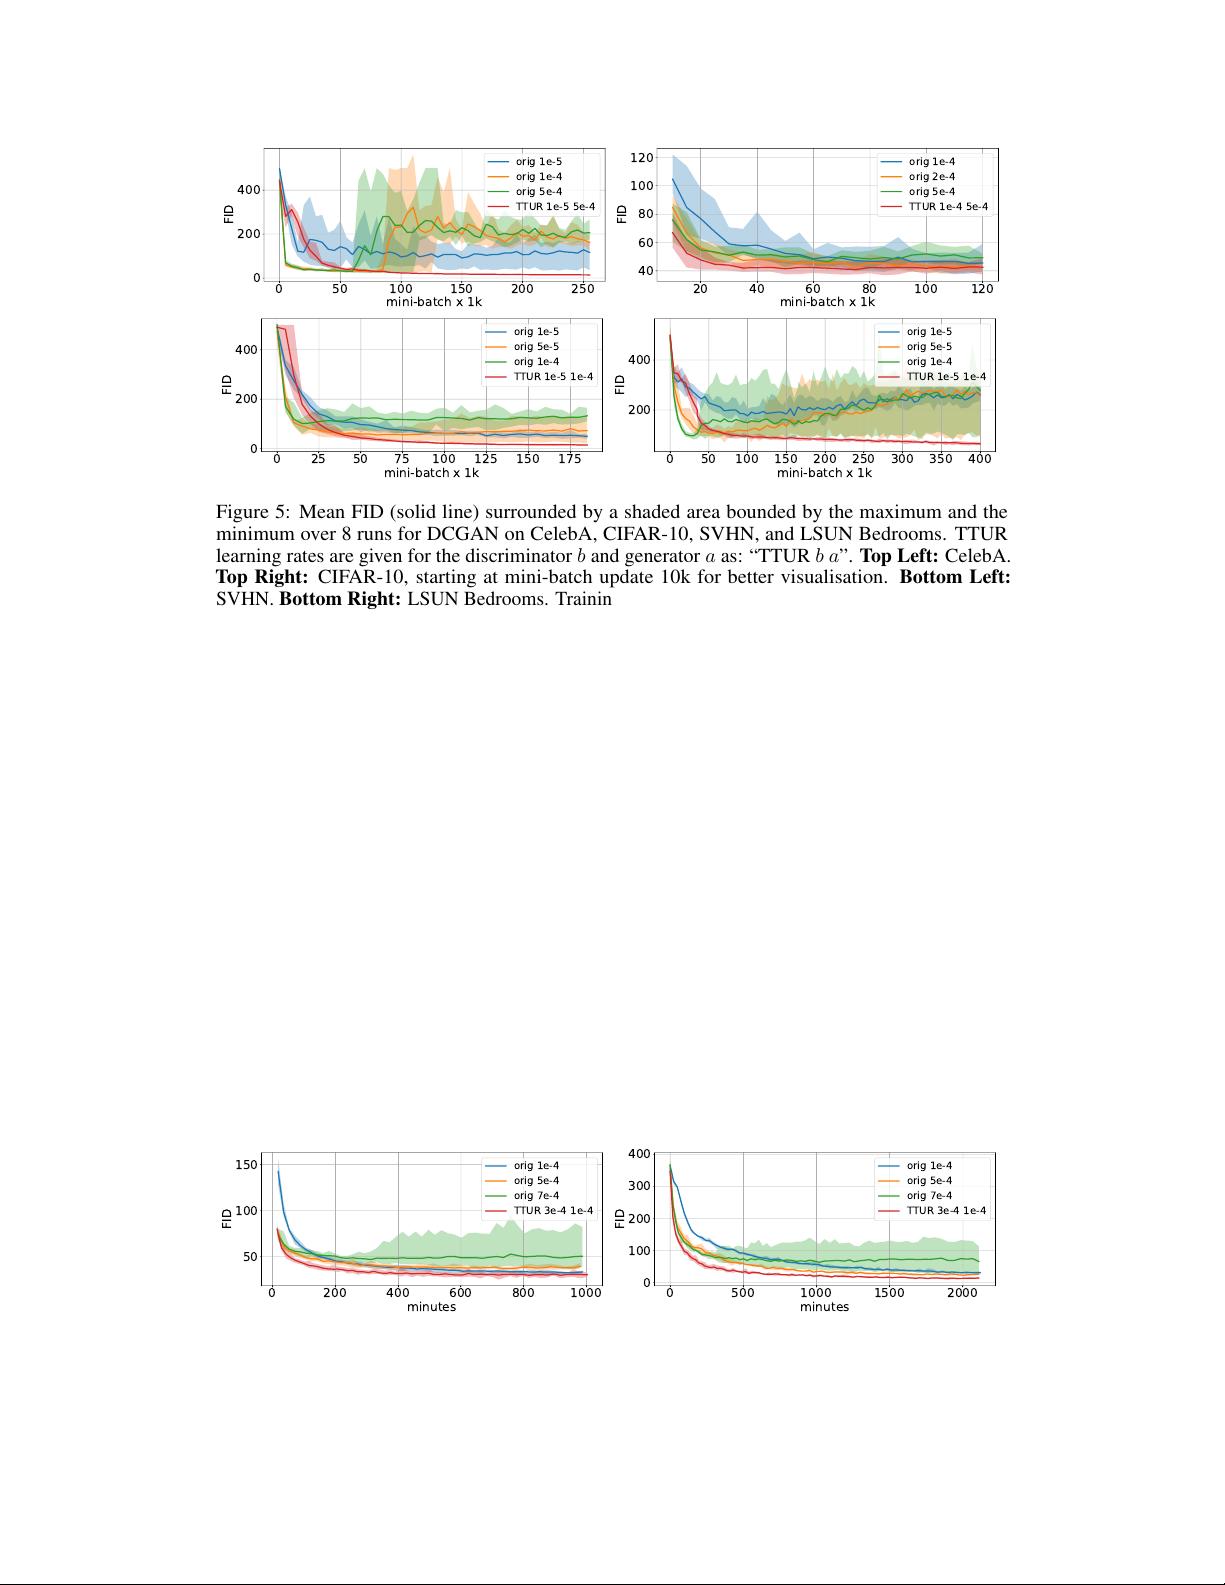
the best models was no longer decreasing. For some models, we observed that the FID diverges
or starts to increase at a certain time point. An example of this behaviour is shown in Fig. 5. The
performance of generative models is evaluated via the Fréchet Inception Distance (FID) introduced
above. For the One Billion Word experiment, the normalized JSD served as performance measure.
For computing the FID, we propagated all images from the training dataset through the pretrained
Inception-v3 model following the computation of the Inception Score [
53
], however, we use the last
pooling layer as coding layer. For this coding layer, we calculated the mean
m
w
and the covariance
matrix
C
w
. Thus, we approximate the first and second central moment of the function given by
the Inception coding layer under the real world distribution. To approximate these moments for the
model distribution, we generate 50,000 images, propagate them through the Inception-v3 model, and
then compute the mean
m
and the covariance matrix
C
. For computational efficiency, we evaluate
the FID every 1,000 DCGAN mini-batch updates, every 5,000 WGAN-GP outer iterations for the
image experiments, and every 100 outer iterations for the WGAN-GP language model. For the one
time-scale updates a WGAN-GP outer iteration for the image model consists of five discriminator
mini-batches and ten discriminator mini-batches for the language model, where we follow the original
implementation. For TTUR however, the discriminator is updated only once per iteration. We repeat
the training for each single time-scale (orig) and TTUR learning rate eight times for the image
datasets and ten times for the language benchmark. Additionally to the mean FID training progress
we show the minimum and maximum FID over all runs at each evaluation time-step. For more details,
implementations and further results see Appendix Section A4 and A6.
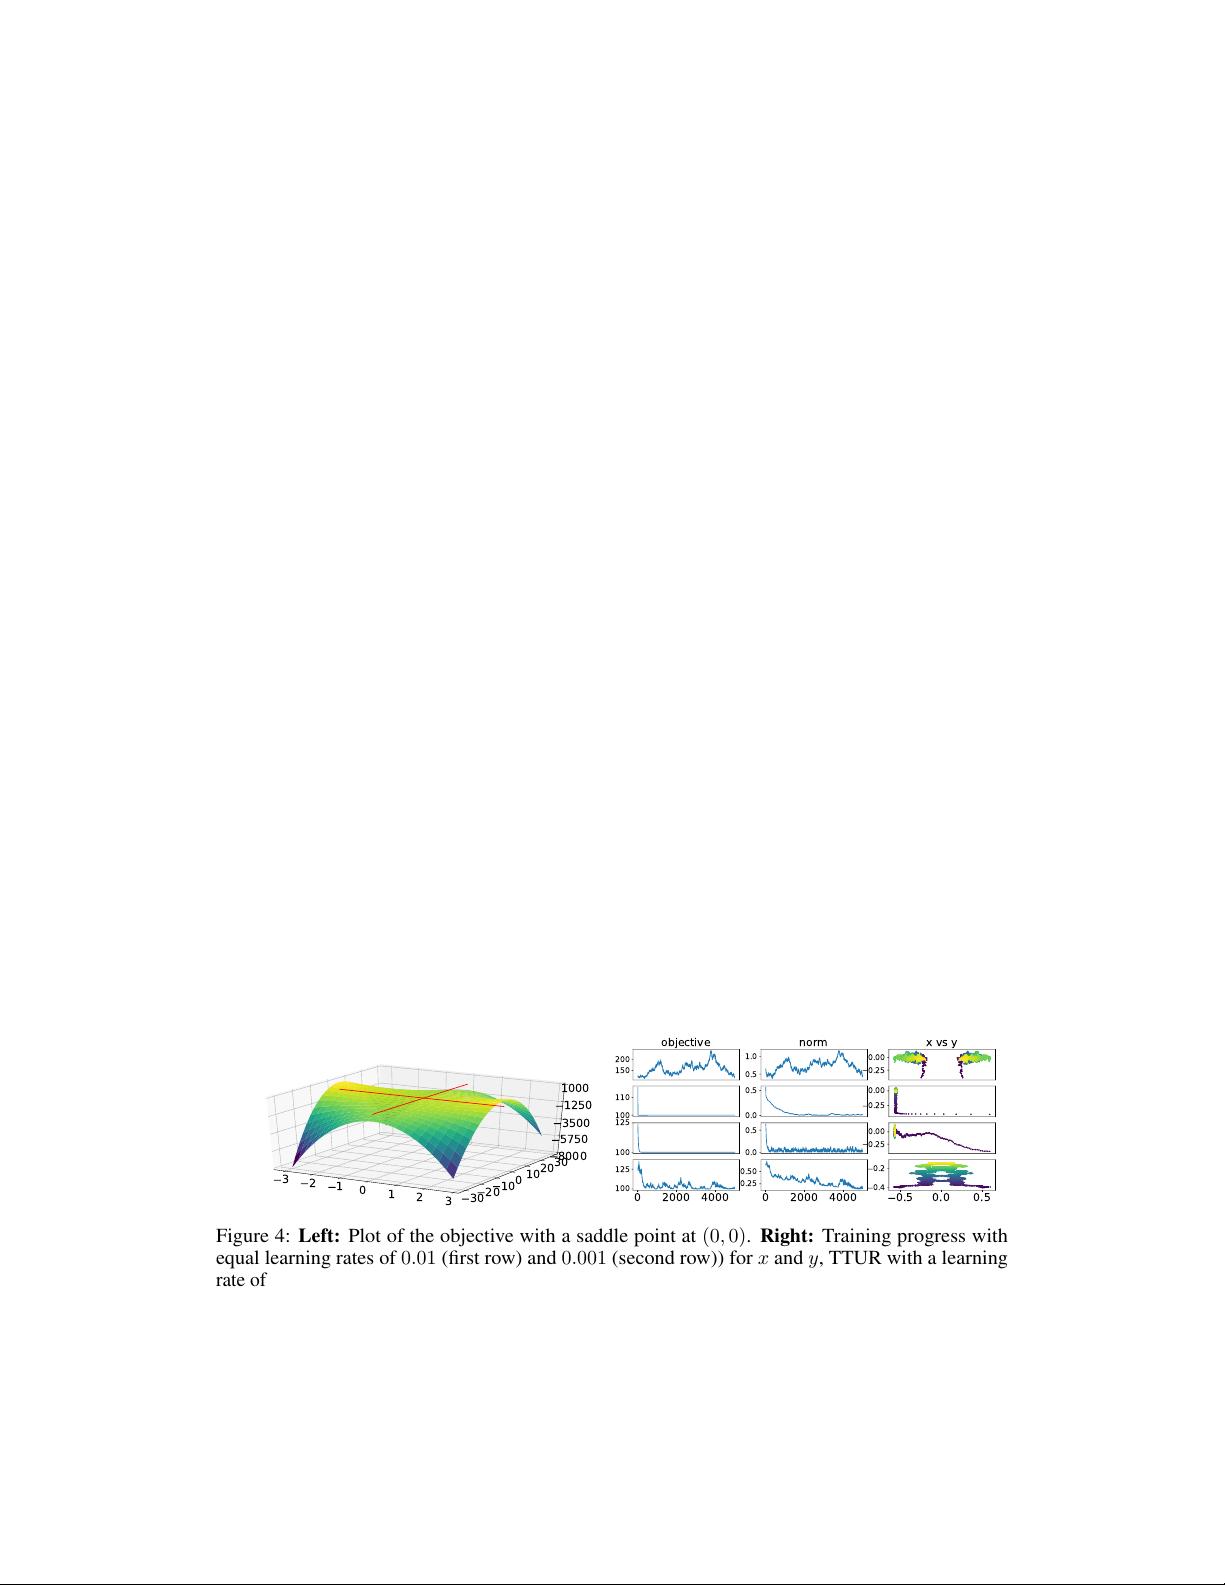
Simple Toy Data.
We first want to demonstrate the difference between a single time-scale update
rule and TTUR on a simple toy min/max problem where a saddle point should be found. The
objective
f(x, y) = (1 + x
2
)(100 − y
2
)
in Fig. 4 (left) has a saddle point at
(x, y) = (0, 0)
and
fulfills assumption A4. The norm
k(x, y)k
measures the distance of the parameter vector
(x, y)
to
the saddle point. We update
(x, y)
by gradient descent in
x
and gradient ascent in
y
using additive
Gaussian noise in order to simulate a stochastic update. The updates should converge to the saddle
point
(x, y) = (0, 0)
with objective value
f(0, 0) = 100
and the norm
0
. In Fig. 4 (right), the first
two rows show one time-scale update rules. The large learning rate in the first row diverges and has
large fluctuations. The smaller learning rate in the second row converges but slower than the TTUR in
the third row which has slow
x
-updates. TTUR with slow
y
-updates in the fourth row also converges
but slower.
3
2
1
0
1
2
3
30
20
10
0
10
20
30
8000
5750
3500
1250
1000
150
200
objective
0.5
1.0
norm
0.25
0.00
x vs y
100
110
0.0
0.5
0.25
0.00
100
125
0.0
0.5
0.25
0.00
0 2000 4000
100
125
0 2000 4000
0.25
0.50
0.5 0.0 0.5
0.4
0.2
Figure 4:
Left:
Plot of the objective with a saddle point at
(0, 0)
.
Right:
Training progress with
equal learning rates of
0.01
(first row) and
0.001
(second row)) for
x
and
y
, TTUR with a learning
rate of
0.0001
for
x
vs.
0.01
for
y
(third row) and a larger learning rate of
0.01
for
x
vs.
0.0001
for
y
(fourth row). The columns show the function values (left), norms (middle), and
(x, y)
(right). TTUR
(third row) clearly converges faster than with equal time-scale updates and directly moves to the
saddle point as shown by the norm and in the (x, y)-plot.
DCGAN on Image Data.
We test TTUR for the deep convolutional GAN (DCGAN) [
51
] at the
CelebA, CIFAR-10, SVHN and LSUN Bedrooms dataset. Fig. 5 shows the FID during learning
7
剩余37页未读,继续阅读


