卷积神经网络可视化技术:理解网络内部工作机制
发布时间: 2024-09-05 11:32:13 阅读量: 138 订阅数: 58 

# 1. 卷积神经网络可视化技术概述
卷积神经网络(Convolutional Neural Network, CNN)的可视化技术在深度学习领域扮演着重要的角色。它不仅增强了开发者对网络内部工作机制的理解,还帮助研究人员和工程师直观地分析和诊断模型行为。本章将概述CNN可视化技术的重要性,并为接下来的深入讨论奠定基础。
可视化技术通过图形化的方式,揭示CNN在处理输入数据时每一层的激活模式,如何从原始像素中学习到高级特征。这是通过提取并展示不同层的特征图(feature maps)和激活图(activation maps)来实现的,有助于优化模型架构、诊断训练问题,甚至增强模型的解释性。接下来的章节将探索CNN的基础理论、实践方法、内部工作机制,以及可视化技术的高级应用和未来发展的方向。
# 2. CNN基础理论与架构解析
### 2.1 卷积神经网络的基本组成
#### 2.1.1 卷积层、池化层和全连接层的作用
卷积神经网络(CNN)是一种深度学习模型,它由多种类型的层组成,其中包括卷积层、池化层和全连接层。每种层在CNN中扮演着特定的角色,共同工作以实现图像识别和分类等任务。
- **卷积层**:卷积层是CNN中最核心的部分,负责提取输入数据的特征。通过卷积操作,网络能够捕捉到数据中的局部特征,并通过可训练的卷积核权重来识别图像中的模式。卷积操作在数学上可以视为一种滤波器,通过与输入图像进行卷积运算生成特征图(feature map)。
- **池化层**:池化层(Pooling layer)通常紧跟在卷积层之后,用于降低特征图的空间尺寸,也就是减少数据的维度,从而减少参数数量和计算量,同时提高网络对小的几何变形的容忍度。常见的池化操作包括最大池化(Max Pooling)和平均池化(Average Pooling)。最大池化通过选取区域内的最大值来达到降维的目的,而平均池化则是计算区域内的平均值。
- **全连接层**:全连接层位于CNN的末端,是网络进行分类决策的关键。在经过多个卷积层和池化层提取和降低维度后,数据被展平(flatten)并通过一个或多个全连接层来进行分类。这些层能够整合特征并进行复杂的决策。
```python
import tensorflow as tf
# 创建一个简单的CNN模型
model = tf.keras.Sequential([
# 卷积层
tf.keras.layers.Conv2D(32, (3, 3), activation='relu', input_shape=(64, 64, 3)),
# 池化层
tf.keras.layers.MaxPooling2D((2, 2)),
# 全连接层
tf.keras.layers.Flatten(),
tf.keras.layers.Dense(10, activation='softmax')
])
```
在上面的代码块中,我们构建了一个简单的CNN模型,包含了卷积层、最大池化层和全连接层。卷积层使用了32个3x3的卷积核,激活函数采用ReLU;最大池化层将特征图的空间尺寸减半。最后,全连接层将展平的特征向量用于最终的分类。
#### 2.1.2 激活函数的角色和类型
激活函数在卷积神经网络中扮演着至关重要的角色。激活函数的作用是为网络引入非线性因素,使得网络能够学习和表达复杂的函数映射关系。
- **ReLU函数**:最常用的激活函数是修正线性单元(Rectified Linear Unit, ReLU),它将所有负值设置为零,保留正值不变。这种单侧抑制使模型在训练过程中能够加速收敛,同时避免了梯度消失的问题。
- **Sigmoid函数**:Sigmoid函数将输入值映射到(0,1)区间内,使得输出可以被解释为概率。然而,Sigmoid函数在两端的梯度接近于零,容易造成梯度消失,因此在深层网络中使用得较少。
- **Tanh函数**:双曲正切函数(Tanh)的输出范围是(-1,1),它的中心在零点,相比于Sigmoid更有利于负数输入的处理,但仍然存在梯度消失的问题。
- **Leaky ReLU**:Leaky ReLU是一种改进的ReLU版本,它允许在激活函数中有一个小的非零斜率(例如0.01),使得即使是负数输入也有一定的输出,这有助于解决ReLU中的“死亡ReLU”问题。
```python
# 使用Leaky ReLU作为激活函数
model = tf.keras.Sequential([
tf.keras.layers.Conv2D(32, (3, 3), input_shape=(64, 64, 3)),
tf.keras.layers.LeakyReLU(alpha=0.01),
tf.keras.layers.MaxPooling2D((2, 2)),
tf.keras.layers.Flatten(),
tf.keras.layers.Dense(10, activation='softmax')
])
```
激活函数的选择对于CNN模型的性能有显著影响。Leaky ReLU激活函数的使用,在上述代码示例中展示了如何通过Keras API实现。在构建网络时,根据任务的特性和需求选择合适的激活函数是很重要的。
# 3. CNN可视化技术的实践方法
## 3.1 可视化工具和库的介绍
在本章的介绍中,我们将深入探讨CNN可视化技术的实践方法,这些方法能够帮助我们更好地理解模型的工作原理,以及在实际应用中遇到的问题和挑战。首先,我们将了解各种可视化工具和库,它们是实现可视化实践的基础。
### 3.1.1 工具选择:TensorBoard、Netron等
TensorBoard是TensorFlow提供的可视化工具,它能够展示训练过程中的各种指标,如损失、准确率以及模型架构等。通过它,我们可以直观地看到模型训练的进度和效果,也可以深入了解模型的内部结构。以下是TensorBoard的一个简单示例代码:
```python
import tensorflow as tf
# 创建一个简单的模型
model = tf.keras.Sequential([
tf.keras.layers.Flatten(input_shape=(28, 28)),
tf.keras.layers.Dense(128, activation='relu'),
tf.keras.layers.Dropout(0.2),
tf.keras.layers.Dense(10, activation='softmax')
])
# 编译模型
***pile(
optimizer='adam',
loss='sparse_categorical_crossentropy',
metrics=['accuracy']
)
# 训练模型,并使用TensorBoard
tensorboard_callback = tf.keras.callbacks.TensorBoard(log_dir='./logs', histogram_freq=1)
model.fit(x_train, y_train, epochs=5, validation_data=(x_test, y_test), callbacks=[tensorboard_callback])
```
在上述代码中,我们首先构建了一个简单的神经网络模型。然后,我们在模型训练时加入TensorBoard的回调函数,它会在指定的日志目录中记录训练过程中的数据。通过启动TensorBoard服务,我们可以通过Web界面查看这些数据,从而实现对训练过程的可视化。
Netron是一个独立的可视化工具,它支持多种深度学习框架模型的可视化,如ONNX、TensorFlow、PyTorch等。Netron可以加载训练好的模型,并提供一个图形界面展示模型的架构和层次结构。这对于理解和调试模型是非常有用的。
### 3.1.2 可视化库的使用:matplotlib、seaborn等
除了专门的可视化工具之外,我们还可以使用Python中的可视化库来实现CNN模型的可视化。matplotlib和seaborn是两个非常流行的可视化库,它们提供了丰富的功能来帮助我们生成图表和图形。
```python
import matplotlib.pyplot as plt
import seaborn as sns
# 假设我们有一个模型,我们提取了某一层的特征图
feature_map = model.layers[1].output
# 使用matplotlib展示特征图
plt.imshow(feature_map[0, :, :, 0], cmap='gray')
plt.show()
# 使用seaborn展示权重分布
weights = model.layers[0].weights[0].numpy()
sns.heatmap(weights[:, :, 0, 0].T, cmap='viridis')
plt.show()
```
在这段代码中,我们首先使用matplotlib库来展示从模型中提取的特征图。然后,我们使用seaborn库来绘制权重的热力图。通过这些可视化的手段,我们可以直观地看到特征图和权重的分布情况。
## 3.2 特征图和激活图的可视化
### 3.2.1 特征图的提取和分析
特征图是卷积神经网络中描述输入数据特征的中间结果。特征图的可视化可以帮助我们理解模型在处理数据时提取的特征类型。通常,我们可以通过修改网络模型或者使用特定的库来提取特征图。
```python
import numpy as np
from tensorflow.keras.models import Model
# 假设我们的模型名为model
intermediate_layer_model = Model(inputs=model.input, outputs=model.layers[1].output)
features = intermediate_layer_model.predict(np.expand_dims(x_data[0], axis=0))
# 现在features变量包含了特征图的数据,我们可以进一步进行可视化分析
```
上述代码中,我们通过构建一个新的模型`intermediate_layer_model`,它将输出指定层的特征图。之后,我们用这个模型对输入数据进行预测,获取特征图。
### 3.2.2 激活图的生成与解释
激活图是指激活函数应用于特征图之后的结果。通过观察激活图,我们可以了解模型是如何响应输入数据的。通常,激活图比原始特征图更容易解释。
```python
import tensorflow.keras.backend as K
def get_activation(layer, model):
act_function = layer.get_config()['activation']
if act_function == 'relu':
return K.function([model.input], [layer.output])([np.expand_dims(x_data[0], axis=0)])[0]
# 其他激活函数的处理类似,根据实际使用的激活函数进行返回相应的处理结果
```
这段代码展示了如何获取特定层的激活结果。首先,我们通过层的配置获取其激活函数名称,然后根据激活函数的不同,执行不同的操作以获取激活图。
## 3.3 权重和梯度的可视化
### 3.3.1 权重分布的可视化技术
权重是CNN模型中的重要参数,可视化权重可以帮助我们了解模型学习到的模式。权重分布的可视化有助于识别可能的过拟合或者欠拟合情况。
```python
wei
```

 百万级
高质量VIP文章无限畅学
百万级
高质量VIP文章无限畅学
 千万级
优质资源任意下载
千万级
优质资源任意下载
 C知道
免费提问 ( 生成式Al产品 )
C知道
免费提问 ( 生成式Al产品 )
0
0
相关推荐

专栏简介
本专栏深入探讨了卷积神经网络(CNN)在各个领域的广泛应用。从图像识别到视频分析,再到自然语言处理,CNN 正在彻底改变各种行业。
专栏文章涵盖了 CNN 的基础知识,包括构建图像识别模型和选择激活函数。它还深入探讨了 CNN 在视频分析中的应用,从数据预处理到模型部署。此外,专栏还介绍了 CNN 在自然语言处理中的创新应用,以及权重初始化策略、批量归一化和注意力机制等高级技术。
为了帮助读者了解 CNN 的实际应用,专栏提供了实战案例,包括从数据预处理到模型部署的完整指南。它还介绍了 CNN 在自动驾驶车辆中的应用,以及模型压缩、加速和可视化技术。通过这些文章,读者可以深入了解 CNN 的强大功能,并了解如何在自己的项目中应用它们。
专栏目录
最低0.47元/天 解锁专栏
买1年送3月
百万级
高质量VIP文章无限畅学
千万级
优质资源任意下载
C知道
免费提问 ( 生成式Al产品 )
最新推荐
矢量控制技术深度解析:电气机械理论与实践应用全指南
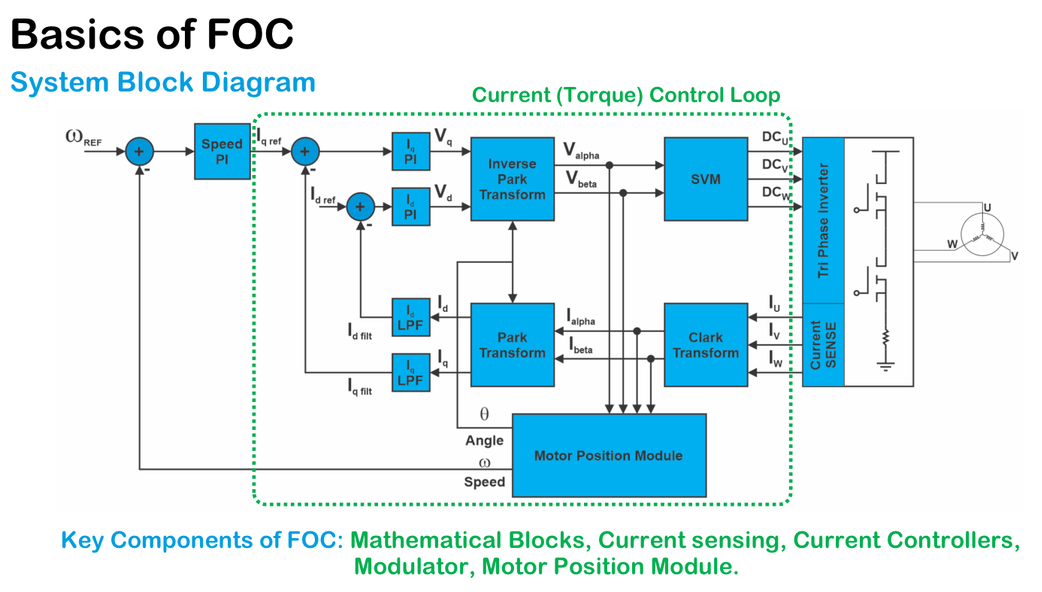
# 摘要
矢量控制技术是电力电子和电气传动领域的重要分支,它通过模拟直流电机的性能来控制交流电机,实现高效率和高精度的电机控制。本文首先概述了矢量控制的基本概念和理论基础,包括电气机械控制的数学模型、矢量变换理论以及相关的数学工具,如坐标变换、PI调节器和PID控制。接着,文章探讨了矢量控制技术在硬件和软件层面的实现,包括电力
【深入解析】:掌握Altium Designer PCB高级规则的优化设置

# 摘要
随着电子设备的性能需求日益增长,PCB设计的复杂性和精确性要求也在提升。Altium Designer作为领先的电子设计自动化软件,其高级规则对确保PCB设计质量起着至关重要的作用。本文详细介绍了Altium Designer PCB设计的基础知识、高级规则的理论基础、实际应用、进阶技巧以及优化案例研究,强调了
Oracle11g x32位在Linux下的安全设置:全面保护数据库的秘诀

# 摘要
Oracle 11g数据库安全是保障企业数据资产的关键,涉及多个层面的安全加固和配置。本文从操作系统层面的安全加固出发,探讨了用户和权限管理、文件系统的安全配置,以及网络安全的考量。进一步深入分析了Oracle 11g数据库的安全设置,如身份验证和授权机制、审计策略实施和数据加密技术的应用。文章还介绍了数据库内部的安全策略,包括安全配置的高级选项、防护措
RJ接口升级必备:技术演进与市场趋势的前瞻性分析
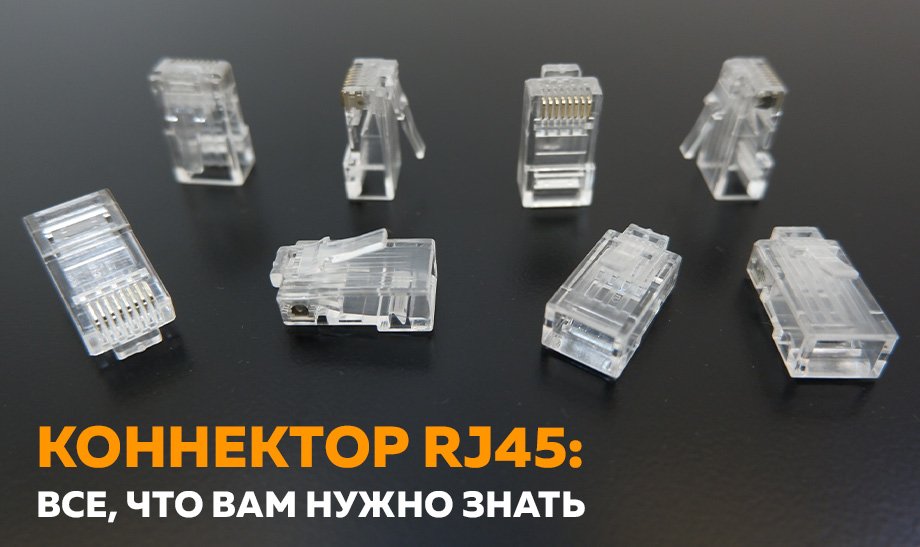
# 摘要
RJ接口作为通信和网络领域的重要连接器,其基础知识和演进历程对技术发展具有深远影响。本文首先回顾了RJ接口的发展历史和技术革新,分析了其物理与电气特性以及技术升级带来的高速数据传输与抗干扰能力的提升。然后,探讨了RJ接口在不同行业应用的现状和特点,包括在通信、消费电子和工业领域的应用案例。接着,文章预测了RJ接口市场的未来趋势,包括市场需求、竞争环境和标准化进程。
MATLAB线性方程组求解:这4种策略让你效率翻倍!
# 摘要
MATLAB作为一种高效的数学计算和仿真工具,在解决线性方程组方面展现出了独特的优势。本文首先概述了MATLAB求解线性方程组的方法,并详细介绍了直接法和迭代法的基本原理及其在MATLAB中的实现。直接法包括高斯消元法和LU分解,而迭代法涵盖了雅可比法、高斯-赛德尔法和共轭梯度法等。本文还探讨了矩阵分解技术的优化应用,如QR分解和奇异值分解(SVD),以及它们在提升求解效率和解决实际问题中的作用。最后,通过具体案例分析,本文总结了工程应用中不同类型线性方程组的求解策略,并提出了优化求解效率的建议。
# 关键字
MATLAB;线性方程组;高斯消元法;LU分解;迭代法;矩阵分解;数值稳
【效率提升算法设计】:算法设计与分析的高级技巧
# 摘要
本文全面探讨了算法设计的基础知识、分析技术、高级技巧以及实践应用,并展望了未来算法的发展方向。第一章概述了算法设计的基本概念和原则,为深入理解算法提供了基础。第二章深入分析了算法的时间复杂度与空间复杂度,并探讨了算法的正确性证明和性能评估方法。第三章介绍了高级算法设计技巧,包括分治策略、动态规划和贪心算法的原理和应用。第四章将理论与实践相结合,讨论了数据结构在算法设计中的应用、算法设计模式和优化策略。最后一章聚焦于前
【全面性能评估】:ROC曲线与混淆矩阵在WEKA中的应用

# 摘要
本文从性能评估的角度,系统介绍了ROC曲线和混淆矩阵的基本概念、理论基础、计算方法及其在WEKA软件中的应用。首先,本文对ROC曲线进行了深入
MTi故障诊断到性能优化全攻略:保障MTi系统稳定运行的秘诀

# 摘要
本文系统地阐述了MTi系统的故障诊断和性能调优的理论与实践。首先介绍了MTi系统故障诊断的基础知识,进而详细分析了性能分析工具与方法。实践应用章节通过案例研究展示了故障诊断方法的具体操作。随后,文章讨论了MTi系统性能调优策略,并提出了保障系统稳定性的措施。最后,通过案例分析总结了经验教训,为类似系统的诊断和优化提供了宝贵的参考。本文
数字电路实验三进阶课程:高性能组合逻辑设计的7大技巧

# 摘要
组合逻辑设计是数字电路设计中的核心内容,对提升系统的性能与效率至关重要。本文首先介绍了组合逻辑设计的基础知识及其重要性,随后深入探讨了高性能组合逻辑设计的理论基础,包括逻辑门的应用、逻辑简化原理、时间分析及组合逻辑电路设计的优化。第三章详细阐述了组合逻辑设计的高级技巧,如逻辑电路优化重构、流水线技术的结合以及先进设计方法学的应用。第四章通过实践应用探讨了设计流程、仿真验证
【CUDA图像处理加速技术】:中值滤波的稀缺优化策略与性能挑战分析

# 摘要
随着并行计算技术的发展,CUDA已成为图像处理领域中加速中值滤波算法的重要工具。本文首先介绍了CUDA与图像处理基础,然后详细探讨了CUDA中值滤波算法的理论和实现,包括算法概述、CUDA的并行编程模型以及优化策略。文章进一步分析了中值滤波算法面临的性
资源上传下载、课程学习等过程中有任何疑问或建议,欢迎提出宝贵意见哦~我们会及时处理!
点击此处反馈


专栏目录
最低0.47元/天 解锁专栏
买1年送3月
百万级
高质量VIP文章无限畅学
千万级
优质资源任意下载
C知道
免费提问 ( 生成式Al产品 )