XGBoost回归分析中的模型融合:打造更强大的预测模型,提升数据挖掘准确性
发布时间: 2024-08-20 04:03:47 阅读量: 48 订阅数: 30 
# 1. 模型融合概述**
### 1.1 模型融合的概念和优势
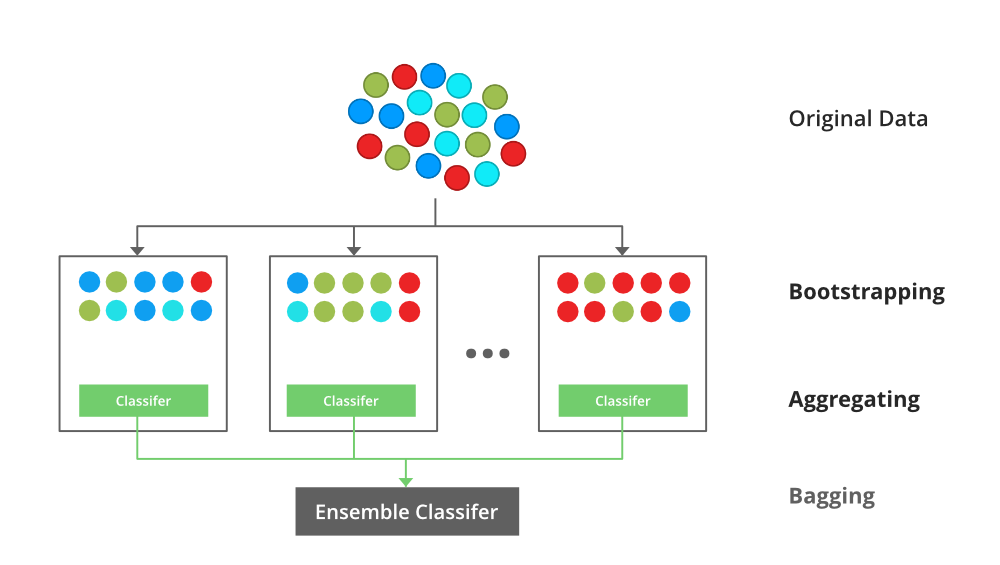
模型融合是一种机器学习技术,它通过组合多个模型的预测结果来提高整体预测性能。它通过利用不同模型的优势,弥补它们的不足,从而获得比单个模型更准确和鲁棒的预测。
### 1.2 模型融合的类型和方法
模型融合有多种类型,包括:
* **加权平均法:**根据每个模型的预测置信度或权重,对模型预测结果进行加权平均。
* **投票法:**根据每个模型的预测结果,进行多数表决或加权投票。
* **堆叠法:**将多个模型的预测结果作为输入特征,构建一个新的元模型进行最终预测。
# 2. XGBoost回归分析基础
### 2.1 XGBoost算法原理和特点
**2.1.1 梯度提升决策树**
XGBoost是一种基于梯度提升算法的机器学习模型,它通过构建一系列决策树来预测目标变量。每个决策树都基于前一个决策树的预测误差进行训练,从而逐步减少整体预测误差。
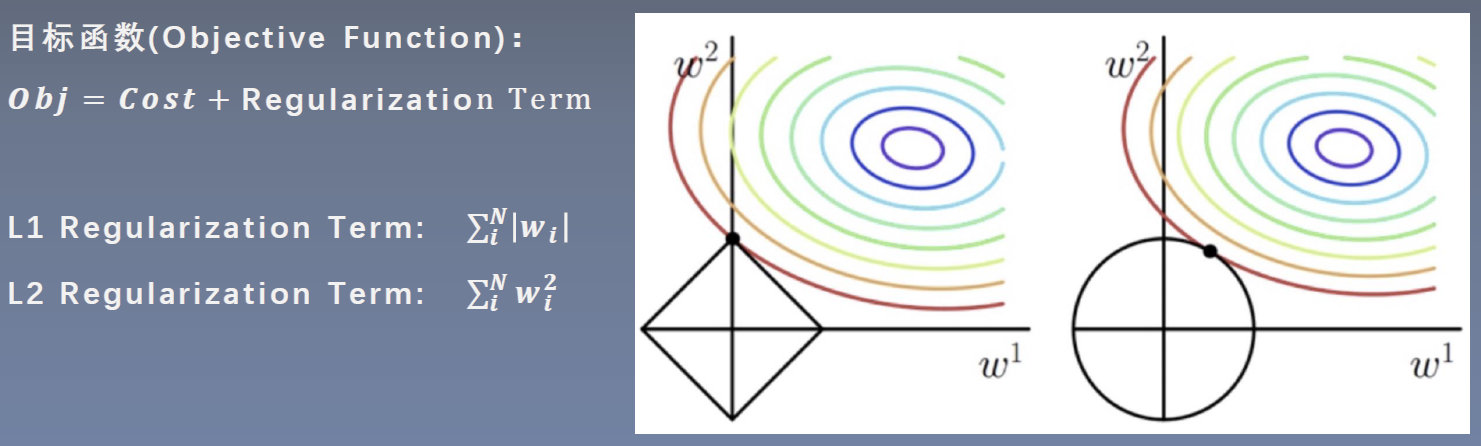
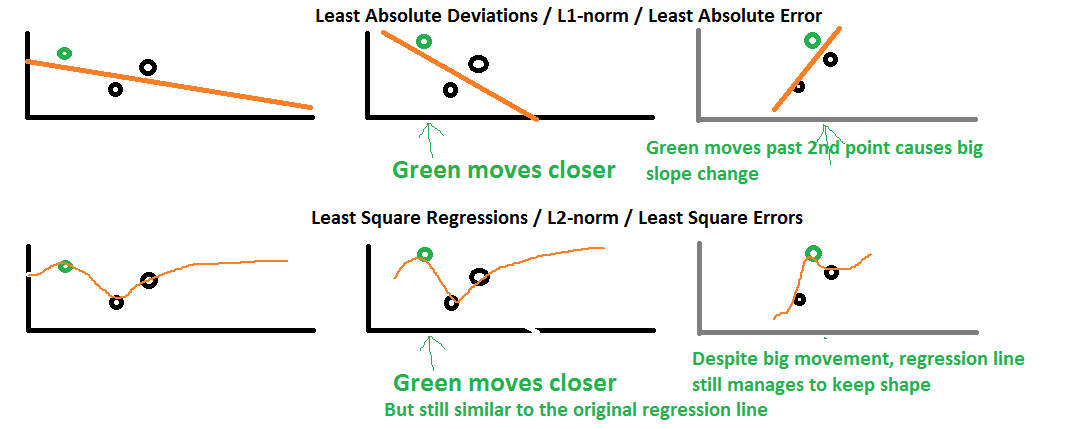
**2.1.2 正则化和特征选择**
XGBoost算法引入了正则化项,包括L1正则化和L2正则化,以防止过拟合。L1正则化通过惩罚模型中特征的绝对值来实现特征选择,而L2正则化通过惩罚模型中特征的平方值来实现特征选择。
### 2.2 XGBoost回归模型构建和评估
**2.2.1 数据预处理和特征工程**
在构建XGBoost回归模型之前,需要对数据进行预处理和特征工程,包括数据清洗、缺失值处理、特征缩放和特征选择。
**2.2.2 模型超参数调优**
XGBoost算法具有大量的超参数,需要通过调优来获得最佳模型。常用的超参数包括:
* `n_estimators`:决策树的数量
* `max_depth`:决策树的最大深度
* `learning_rate`:学习率
* `reg_alpha`:L1正则化参数
* `reg_lambda`:L2正则化参数
**2.2.3 模型评估和选择**
模型构建完成后,需要对模型进行评估,常用的评估指标包括:
* 均方根误差(RMSE)
* 平均绝对误差(MAE)
* R平方值(R2)
通过比较不同模型的评估指标,选择性能最佳的模型。
```python
import xgboost as xgb
# 构建XGBoost回归模型
model = xgb.XGBRegressor(n_estimators=100, max_depth=5, learning_rate=0.1, reg_alpha=0.1, reg_lambda=0.1)
# 训练模型
model.fit(X_train, y_train)
# 预测结果
y_pred = model.predict(X_test)
# 评估模型
rmse = np.sqrt(mean_squared_error(y_test, y_pred))
mae = mean_a
```

 百万级
高质量VIP文章无限畅学
百万级
高质量VIP文章无限畅学
 千万级
优质资源任意下载
千万级
优质资源任意下载
 C知道
免费提问 ( 生成式Al产品 )
C知道
免费提问 ( 生成式Al产品 )
0
0
相关推荐

专栏简介
本专栏以“XGBoost与回归分析技巧”为题,深入探讨了XGBoost回归分析的各个方面。专栏文章从入门指南到高级调参技巧,再到实战案例分享和与传统回归模型的对比,全面覆盖了XGBoost回归分析的知识体系。此外,专栏还重点关注了特征工程、超参数优化、过拟合和欠拟合处理、异常值处理、多重共线性问题、树模型可解释性、特征重要性评估、并行计算、分布式训练、云计算应用、GPU加速、集成学习和模型融合等关键技术。通过阅读本专栏,读者可以系统地掌握XGBoost回归分析的原理、方法和应用,并将其应用于各种数据挖掘和预测建模任务中。
专栏目录
最低0.47元/天 解锁专栏
买1年送3月
百万级
高质量VIP文章无限畅学
千万级
优质资源任意下载
C知道
免费提问 ( 生成式Al产品 )
最新推荐
PyTorch超参数调优:专家的5步调优指南
# 1. PyTorch超参数调优基础概念
## 1.1 什么是超参数?
在深度学习中,超参数是模型训练前需要设定的参数,它们控制学习过程并影响模型的性能。与模型参数(如权重和偏置)不同,超参数不会在训练过程中自动更新,而是需要我们根据经验或者通过调优来确定它们的最优值。
## 1.2 为什么要进行超参数调优?
超参数的选择直接影响模型的学习效率和最终的性能。在没有经过优化的默认值下训练模型可能会导致以下问题:
- **过拟合**:模型在
【商业化语音识别】:技术挑战与机遇并存的市场前景分析
# 1. 商业化语音识别概述
语音识别技术作为人工智能的一个重要分支,近年来随着技术的不断进步和应用的扩展,已成为商业化领域的一大热点。在本章节,我们将从商业化语音识别的基本概念出发,探索其在商业环境中的实际应用,以及如何通过提升识别精度、扩展应用场景来增强用户体验和市场竞争力。
## 1.1 语音识别技术的兴起背景
语音识别技术将人类的语音信号转化为可被机器理解的文本信息,它
跨平台推荐系统:实现多设备数据协同的解决方案
# 1. 跨平台推荐系统概述
## 1.1 推荐系统的演变与发展
推荐系统的发展是随着互联网内容的爆炸性增长和用户个性化需求的提升而不断演进的。最初,推荐系统主要基于规则来实现,而后随着数据量的增加和技术的进步,推荐系统转向以数据驱动为主,使用复杂的算法模型来分析用户行为并预测偏好。如今,跨平台推荐系统正逐渐成为研究和应用的热点,旨
【图像分类模型自动化部署】:从训练到生产的流程指南
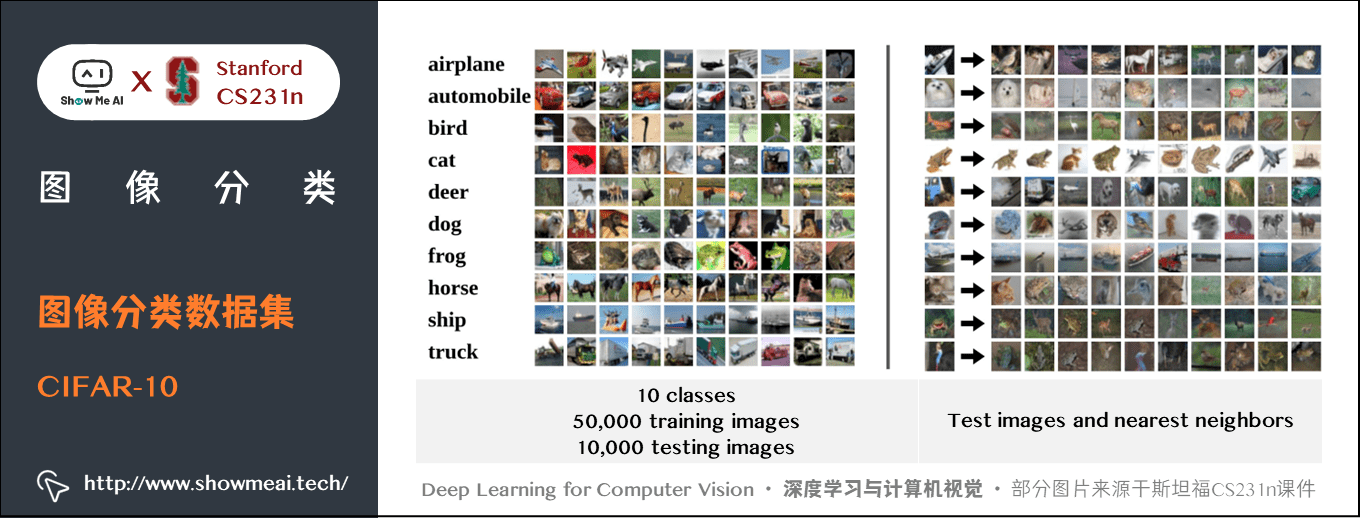
# 1. 图像分类模型自动化部署概述
在当今数据驱动的世界中,图像分类模型已经成为多个领域不可或缺的一部分,包括但不限于医疗成像、自动驾驶和安全监控。然而,手动部署和维护这些模型不仅耗时而且容易出错。随着机器学习技术的发展,自动化部署成为了加速模型从开发到生产的有效途径,从而缩短产品上市时间并提高模型的性能和可靠性。
本章旨在为读者提供自动化部署图像分类模型的基本概念和流程概览,
优化之道:时间序列预测中的时间复杂度与模型调优技巧
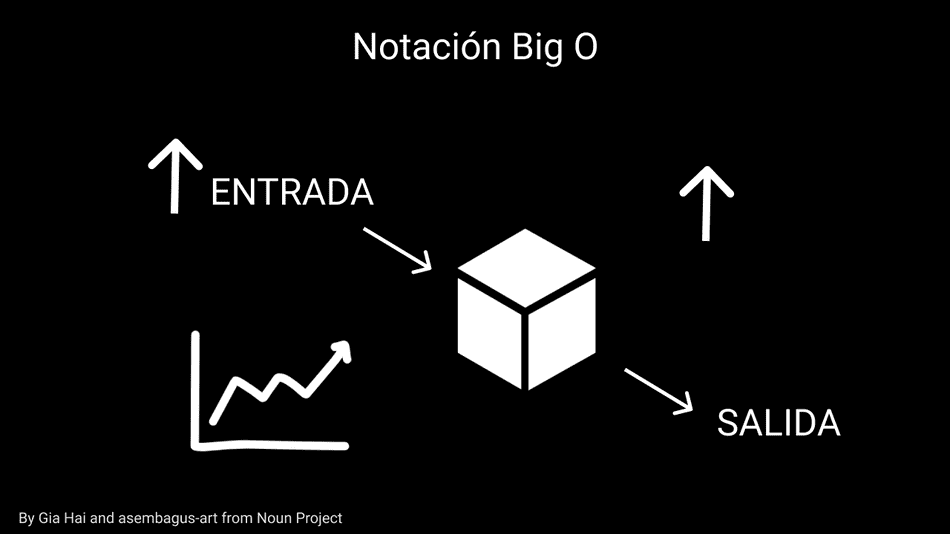
# 1. 时间序列预测概述
在进行数据分析和预测时,时间序列预测作为一种重要的技术,广泛应用于经济、气象、工业控制、生物信息等领域。时间序列预测是通过分析历史时间点上的数据,以推断未来的数据走向。这种预测方法在决策支持系统中占据着不可替代的地位,因为通过它能够揭示数据随时间变化的规律性,为科学决策提供依据。
时间序列预测的准确性受到多种因素的影响,例如数据
【数据集加载与分析】:Scikit-learn内置数据集探索指南
# 1. Scikit-learn数据集简介
数据科学的核心是数据,而高效地处理和分析数据离不开合适的工具和数据集。Scikit-learn,一个广泛应用于Python语言的开源机器学习库,不仅提供了一整套机器学习算法,还内置了多种数据集,为数据科学家进行数据探索和模型验证提供了极大的便利。本章将首先介绍Scikit-learn数据集的基础知识,包括它的起源、
硬件加速在目标检测中的应用:FPGA vs. GPU的性能对比
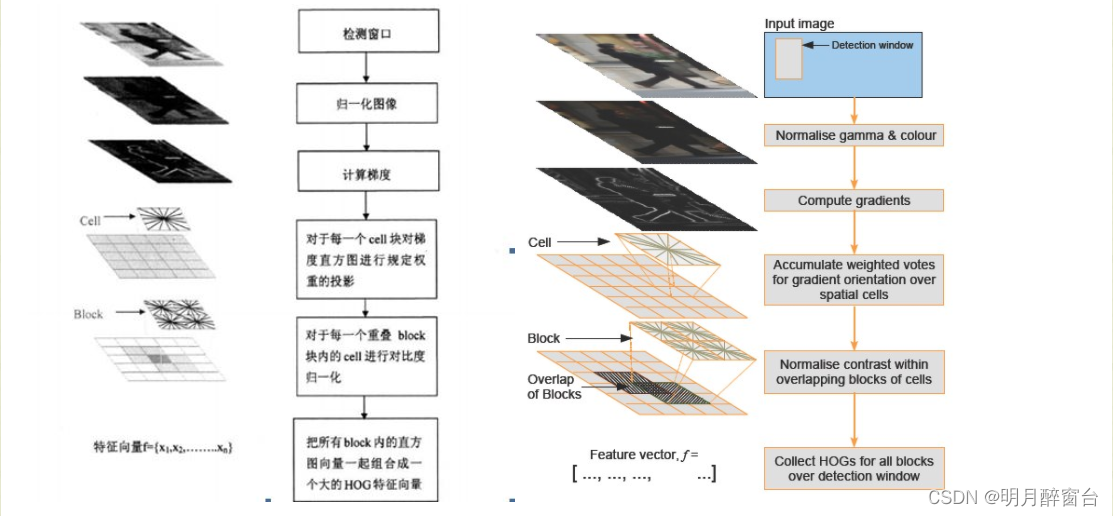
# 1. 目标检测技术与硬件加速概述
目标检测技术是计算机视觉领域的一项核心技术,它能够识别图像中的感兴趣物体,并对其进行分类与定位。这一过程通常涉及到复杂的算法和大量的计算资源,因此硬件加速成为了提升目标检测性能的关键技术手段。本章将深入探讨目标检测的基本原理,以及硬件加速,特别是FPGA和GPU在目标检测中的作用与优势。
## 1.1 目标检测技术的演进与重要性
目标检测技术的发展与深度学习的兴起紧密相关
Keras批量归一化:加速收敛与提升模型稳定性的秘密武器
# 1. 深度学习中的批量归一化基础
批量归一化(Batch Normalization)是深度学习领域的一项关键创新技术,它在神经网络的训练过程中起到了显著的作用。批量归一化的引入主要为了解决网络训练过程中内部协变量偏移(Internal Covariate Shift)的问题,这一问题往往导致网络需要更长时间收敛,并且需要更精细的初始化和学习率调整。通过规范化层的输入值,使得它们拥有零均值和单位方差,批量归一化
图像融合技术实战:从理论到应用的全面教程
# 1. 图像融合技术概述
随着信息技术的快速发展,图像融合技术已成为计算机视觉、遥感、医学成像等多个领域关注的焦点。**图像融合**,简单来说,就是将来自不同传感器或同一传感器在不同时间、不同条件下的图像数据,经过处理后得到一个新的综合信息。其核心目标是实现信息的有效集成,优化图像的视觉效果,增强图像信息的解释能力或改善特定任务的性能。
从应用层面来看,图像融合技术主要分为三类:**像素级**融合,直接对图
【循环神经网络】:TensorFlow中RNN、LSTM和GRU的实现

# 1. 循环神经网络(RNN)基础
在当今的人工智能领域,循环神经网络(RNN)是处理序列数据的核心技术之一。与传统的全连接网络和卷积网络不同,RNN通过其独特的循环结构,能够处理并记忆序列化信息,这使得它在时间序列分析、语音识别、自然语言处理等多
资源上传下载、课程学习等过程中有任何疑问或建议,欢迎提出宝贵意见哦~我们会及时处理!
点击此处反馈


专栏目录
最低0.47元/天 解锁专栏
买1年送3月
百万级
高质量VIP文章无限畅学
千万级
优质资源任意下载
C知道
免费提问 ( 生成式Al产品 )