机器学习算法详解:从线性回归到深度学习,掌握机器学习核心技术
发布时间: 2024-08-25 09:08:56 阅读量: 24 订阅数: 35 
# 1. 机器学习基础
机器学习是人工智能的一个子领域,它赋予计算机从数据中学习的能力,而无需明确编程。机器学习算法可以根据历史数据中的模式和关系,对新数据做出预测或决策。
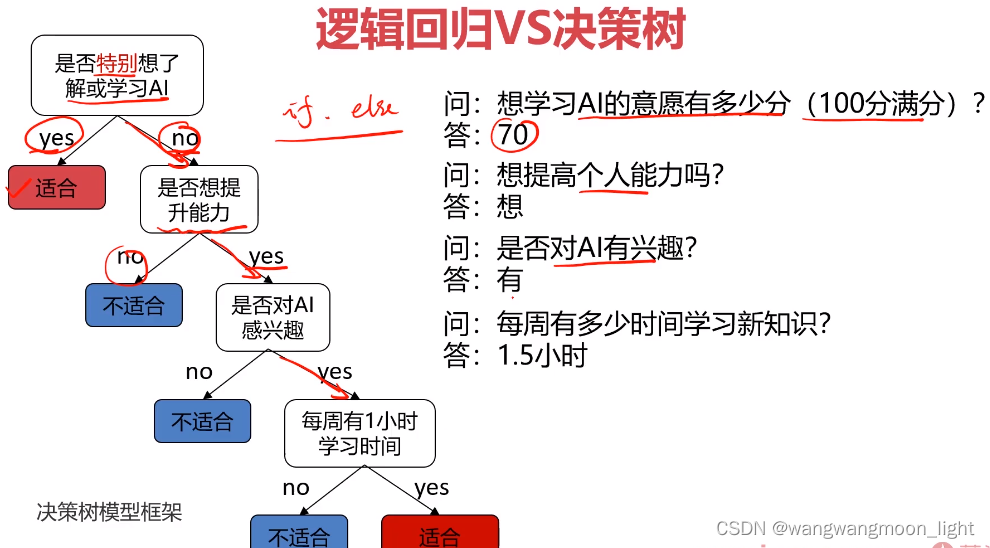
机器学习算法分为监督学习和非监督学习两大类。监督学习算法使用带有已知标签或输出的数据进行训练,而非监督学习算法则使用未标记的数据。监督学习算法的典型示例包括线性回归、逻辑回归和决策树,而非监督学习算法的示例包括聚类算法和降维算法。
# 2. 监督学习算法**
监督学习算法是机器学习中最基础和重要的算法类型之一,它主要用于解决分类和回归问题。在监督学习中,算法会从标记的数据中学习,并建立一个模型来预测新数据的输出。
**2.1 线性回归**
线性回归是一种用于预测连续变量的监督学习算法。它假设输入变量和输出变量之间存在线性关系,并通过最小化平方误差来找到最佳拟合线。
**2.1.1 线性回归模型**
线性回归模型可以表示为:
```
y = β0 + β1x1 + β2x2 + ... + βnxn + ε
```
其中:
* y 是输出变量
* x1, x2, ..., xn 是输入变量
* β0, β1, ..., βn 是模型参数
* ε 是误差项
**2.1.2 线性回归的求解方法**
线性回归模型的参数可以通过最小化平方误差来求解,即:
```
min Σ(y - ŷ)^2
```
其中:
* y 是真实输出
* ŷ 是预测输出
求解该优化问题的方法有很多,其中最常用的是最小二乘法。
**代码块:**
```python
import numpy as np
import pandas as pd
from sklearn.linear_model import LinearRegression
# 准备数据
data = pd.read_csv('data.csv')
X = data[['x1', 'x2']]
y = data['y']
# 训练模型
model = LinearRegression()
model.fit(X, y)
# 预测新数据
new_data = pd.DataFrame({'x1': [10], 'x2': [20]})
y_pred = model.predict(new_data)
# 输出预测结果
print(y_pred)
```
**逻辑分析:**
* 该代码块使用最小二乘法训练了一个线性回归模型,并使用新数据进行了预测。
* `LinearRegression()`函数用于创建线性回归模型。
* `fit()`方法用于训练模型,传入输入数据和输出数据。
* `predict()`方法用于使用训练好的模型对新数据进行预测。
**参数说明:**
* `data.csv`:包含训练数据的CSV文件。
* `x1`、`x2`:输入变量的列名。
* `y`:输出变量的列名。
* `model`:训练好的线性回归模型。
* `new_data`:包含新数据的DataFrame。
* `y_pred`:预测输出。
# 3. 非监督学习算法
非监督学习算法是一种机器学习算法,它从未标记的数据中学习模式和结构。与监督学习算法不同,非监督学习算法不需要预先定义的目标变量或输出。相反,它们根据数据的相似性或差异性将数据点分组或转换。
### 3.1 聚类算法
聚类算法是将数据点分组到称为簇的相似组中的非监督学习算法。每个簇中的数据点彼此相似,但与其他簇中的数据点不同。聚类算法广泛用于数据探索、客户细分和异常检测。
**3.1.1 K-Means聚类**
K-Means聚类是一种流行的聚类算法,它将数据点分配到K个簇中,其中K是一个预先定义的数字。该算法通过以下步骤工作:
1. **初始化:**随机选择K个数据点作为初始簇中心。
2. **分配:**将每个数据点分配到距离其最近的簇中心。
3. **更新:**计算每个簇的平均值,并将簇中心更新为这些平均值。
4. **重复:**重复步骤2和3,直到簇中心不再改变。
**代码块:**
```python
import numpy as np
from sklearn.cluster import KMeans
# 数据点
data = np.array([[1, 2], [3, 4], [5, 6], [7, 8], [9, 10]])
# 创建K-Means模型
kmeans = KMeans(n_clusters=2)
# 拟合模型
kmeans.fit(data)
# 获取簇标签
labels = kmeans.labels_
# 打印簇标签
print(labels)
```
**逻辑分析:**
* `n_clusters`参数指定要创建的簇数。
* `fit()`方法将模型拟合到数据。
* `labels_`属性包含每个数据点的簇标签。
**3.1.2 层次聚类**
层次聚类是一种聚类算法,它创建一棵称为树状图的层次结构,其中每个节点代表一个簇。该算法通过以下步骤工作:
1. **初始化:**将每个数据点视为一个单独的簇。
2. **合并:**找到距离最近的两个簇,并将其合并为一个新的簇。
3. **重复:**重复步骤2,直到所有数据点都被合并到一个簇中。
**代码块:**
```python
import numpy as np
from sklearn.cluster import AgglomerativeClustering
# 数据点
data = np.array([[1, 2], [3, 4], [5, 6], [7, 8], [9, 10]])
# 创建层次聚类模型
clustering = AgglomerativeClustering(n_clusters=2)
# 拟合模型
clustering.fit(data)
# 获取簇标签
labels = clustering.labels_
# 打印簇标签
print(labels)
```
**逻辑分析:**
* `n_clusters`参数指定要创建的簇数。
* `fit()`方法将模型拟合到数据。
* `labels_`属性包含每个数据点的簇标签。
### 3.2 降维算法
降维算法是将高维数据转换为低维表示的非监督学习算法。这可以简化数据可视化、提高算法效率并减少过拟合。
**3.2.1 主成分分析(PCA)**
PCA是一种降维算法,它通过找到数据中方差最大的方向来创建低维表示。该算法通过以下步骤工作:
1. **计算协方差矩阵:**计算数据点的协方差矩阵,该矩阵表示数据点之间的相关性。
2. **计算特征值和特征向量:**计算协方差矩阵的特征值和特征向量。
3. **选择主成分:**选择具有最大特征值的特征向量作为主成分。
**代码块:**
```python
import numpy as np
from sklearn.decomposition import PCA
# 数据点
data = np.array([[1, 2], [3, 4], [5, 6], [7, 8], [9, 10]])
# 创建PCA模型
pca = PCA(n_c
```

 百万级
高质量VIP文章无限畅学
百万级
高质量VIP文章无限畅学
 千万级
优质资源任意下载
千万级
优质资源任意下载
 C知道
免费提问 ( 生成式Al产品 )
C知道
免费提问 ( 生成式Al产品 )
0
0
相关推荐

专栏简介
本专栏深入探讨图的遍历算法,包括 DFS(深度优先搜索)和 BFS(广度优先搜索),揭示其原理和实战应用。专栏还涵盖了 MySQL 事务隔离级别、MySQL 复制原理、Nginx 服务器配置优化、DevOps 实践、机器学习算法、人工智能在 IT 领域的应用、软件设计模式和面向对象编程原则。通过深入浅出的讲解和实际案例,专栏旨在帮助读者掌握图论算法、数据库技术、服务器优化、软件开发和人工智能等领域的精髓,提升他们的技术水平和解决问题的能力。
专栏目录
最低0.47元/天 解锁专栏
买1年送3月
百万级
高质量VIP文章无限畅学
千万级
优质资源任意下载
C知道
免费提问 ( 生成式Al产品 )
最新推荐
Flink1.12.2-CDH6.3.2窗口操作全攻略:时间与事件窗口的灵活应用

# 摘要
Apache Flink作为一个开源的流处理框架,其窗口操作是实现复杂数据流处理的关键机制。本文首先介绍了Flink窗口操作的基础知识和核心概念,紧接着深入探讨了时间窗口在实际应用中的定义、分类、触发机制和优化技巧。随后,本文转向事件窗口的高级应用,分析了事件时间窗口的原理和优化策略,以及时间戳分配器和窗口对齐的重要作用。在整合应用章节中,本文详细讨论了时间窗口和事
【专业性】:性能测试结果大公开:TI-LMP91000模块在信号处理中的卓越表现

# 摘要
性能测试是确保电子产品质量的关键环节,尤其是在深入分析了TI-LMP91000模块的架构及其性能特点后。本文首先介绍了性能测试的理论基础和重要性,然后深入探讨了TI-LMP91000模块的硬件和软件架构,包括其核心组件、驱动程序以及信号处理算法。本文还详细阐述了性能测试的方法,包括测试环境搭建
【Typora多窗口编辑技巧】:高效管理文档与项目的6大技巧

# 摘要
Typora作为一种现代Markdown编辑器,提供了独特的多窗口编辑功能,极大提高了文档编辑的效率与便捷性。本文首先介绍了Typora的基础界面布局和编辑功能,然后详细探讨了多窗口编辑的配置方法和自定义快捷方式,以及如何高效管理文档和使用版本控制。文
企业微信自动化工具开发指南

# 摘要
随着信息技术的飞速发展,企业微信自动化工具已成为提升企业办公效率和管理水平的重要手段。本文全面介绍了企业微信自动化工具的设计和应用,涵盖API基础、脚本编写、实战应用、优化维护以及未来展望。从企业微信API的认证机制和权限管理到自动化任务的实现,详细论述了工具的开发、使用以及优化过程,特别是在脚本编写部分提供了实用技巧和高级场景模拟。文中还探讨了工具在群管理、办公流程和客户关系管理中的实际应用案例
【打造高效SUSE Linux工作环境】:系统定制安装指南与性能优化

# 摘要
本文全面介绍了SUSE Linux操作系统的特点、优势、定制安装、性能优化以及高级管理技巧。首先,文章概述了SUSE Linux的核心优势,并提供了定制安装的详细指南,包括系统规划、分区策略、安装过程详解和系统初始化。随后,深入探讨了性能优化方法,如系统服务调优、内核参数调整和存储优化。文章还涉及了高级管理技巧,包括系统监控、网络配置、自动化任务和脚本管理。最后,重点分析了在SUSE Linux环境下如何强
低位交叉存储器技术精进:计算机专业的关键知识
# 摘要
本文系统地介绍了低位交叉存储器技术的基础知识、存储器体系结构以及性能分析。首先,概述了存储器技术的基本组成、功能和技术指标,随后深入探讨了低位交叉存储技术的原理及其与高位交叉技术的比较。在存储器性能方面,分析了访问时间和带宽的影响因素及其优化策略,并通过实际案例阐释了应用和设计中的问题解决。最后,本文展望了低位交叉存储器技术的发展趋势,以及学术研究与应用需求如何交
【控制仿真与硬件加速】:性能提升的秘诀与实践技巧

# 摘要
本文深入探讨了控制仿真与硬件加速的概念、理论基础及其在不同领域的应用。首先,阐述了控制仿真与硬件加速的基本概念、理论发展与实际应用场景,为读者提供了一个全面的理论框架。随后,文章重点介绍了控制仿真与硬件加速的集成策略,包括兼容性问题、仿真优化技巧以及性能评估方法。通过实际案例分析
【算法作业攻坚指南】:电子科技大学李洪伟课程的解题要点与案例解析

# 摘要
电子科技大学李洪伟教授的课程全面覆盖了算法的基础知识、常见问题分析、核心算法的实现与优化技巧,以及算法编程实践和作业案例分析。课程从算法定义和效率度量入手,深入讲解了数据结构及其在算法中的应用,并对常见算法问题类型给出了具体解法。在此基础上,课程进一步探讨了动态规划、分治法、回溯算法、贪心算法与递归算法的原理与优化方法。通过编程实践章节,学生将学会解题策略、算法在竞赛和实际项目中的应用,并掌握调试与测
AnsoftScript自动化仿真脚本编写:从入门到精通
# 摘要
AnsoftScript是一种专为自动化仿真设计的脚本语言,广泛应用于电子电路设计领域。本文首先概述了AnsoftScript自动化仿真的基本概念及其在行业中的应用概况。随后,详细探讨了AnsoftScript的基础语法、脚本结构、调试与错误处理,以及优化实践应用技巧。文中还涉及了AnsoftScript在跨领域应用、高级数据处理、并行计算和API开发方面的高级编程技术。通过多个项目案例分析,本文展
资源上传下载、课程学习等过程中有任何疑问或建议,欢迎提出宝贵意见哦~我们会及时处理!
点击此处反馈


专栏目录
最低0.47元/天 解锁专栏
买1年送3月
百万级
高质量VIP文章无限畅学
千万级
优质资源任意下载
C知道
免费提问 ( 生成式Al产品 )