深入挖掘:Python数据预处理技术的终极指南
发布时间: 2024-08-31 22:04:23 阅读量: 298 订阅数: 96 

PyDataPreprocessing:《 Python数据预处理技术与实践》源码下载
# 1. 数据预处理的基础概念
在数据分析和机器学习领域,数据预处理是至关重要的一步。它通常涉及将原始数据转换成适合模型处理的格式,目的是提高数据质量,增强模型的性能。数据预处理涵盖一系列技术,包括数据清洗、特征工程、数据集划分等,这些技术有助于减少噪声、处理缺失和异常值,提取和选择有用的特征,以及为模型训练准备数据集。了解和掌握数据预处理的基本概念和方法对于任何数据科学项目的成功都至关重要。在接下来的章节中,我们将深入探讨数据预处理的各个方面,包括具体的技术、操作流程和实战案例。
# 2. ```
# 第二章:数据清洗技术详解
数据清洗作为数据预处理的一个重要环节,是确保数据质量的关键步骤。在这一章节中,我们将深入探讨数据清洗中的核心技术,包括对缺失值、异常值的处理,数据类型的转换,以及数据标准化与归一化的方法。
## 2.1 缺失值处理
### 2.1.1 缺失值识别方法
缺失值是数据集中常见的问题之一,它可能是由于数据收集不完整、数据录入错误或者数据传输过程中的丢失等原因造成的。识别缺失值是处理缺失值的第一步,有多种方法可以用来识别数据集中的缺失值。
- **观察数据集**: 通过观察数据集,检查是否有空格、问号或“NA”等标记。Pandas库中提供了`isnull()`和`notnull()`函数,可以用来检测数据集中的缺失值。
- **描述性统计**: 使用`describe()`函数可以快速得到数据集的统计描述,其中会明确显示数据集中的缺失值数量。
- **可视化分析**: 利用条形图、热力图等可视化手段,可以直观地识别出数据集中缺失值的分布情况。
```python
import pandas as pd
# 加载数据集
df = pd.read_csv('data.csv')
# 检测缺失值
missing_values = df.isnull().sum()
# 输出缺失值统计
print(missing_values)
```
在上述代码中,`isnull()`函数返回一个布尔型DataFrame,其中True表示相应位置的值是缺失的。通过对这个布尔型DataFrame进行求和,我们可以得到每个特征缺失值的数量。
### 2.1.2 缺失值填充策略
在识别出缺失值之后,接下来需要根据实际情况采取合适的填充策略。
- **删除缺失值**: 如果数据集很大,且缺失值占比小,可以考虑直接删除含有缺失值的行或列。
- **填充缺失值**: 可以使用某个统计值(如平均值、中位数、众数)填充,或者使用预测模型来预测缺失值。
```python
# 使用列的均值填充缺失值
df['column'] = df['column'].fillna(df['column'].mean())
```
在上述代码中,`fillna()`函数用于填充缺失值,这里采用的是列均值填充策略。根据数据的特性,我们也可以选择中位数、众数等其他统计值进行填充。
## 2.2 异常值检测与处理
### 2.2.1 异常值检测技术
异常值是数据集中那些不符合预期模式或行为的值。这些值可能是由于错误、噪声或者真实的极端情况造成的。
- **统计方法**: 使用标准差、四分位数范围等统计方法来定义异常值。
- **基于模型的方法**: 使用聚类分析、密度估计等模型来识别异常值。
```python
# 使用四分位数检测异常值
Q1 = df['column'].quantile(0.25)
Q3 = df['column'].quantile(0.75)
IQR = Q3 - Q1
lower_bound = Q1 - 1.5 * IQR
upper_bound = Q3 + 1.5 * IQR
# 检测异常值
outliers = df[(df['column'] < lower_bound) | (df['column'] > upper_bound)]
```
上述代码片段中,我们计算了指定列的四分位数和四分位数范围(IQR),然后定义了异常值的上下界。任何超出这个范围的值被认为是异常值。
### 2.2.2 异常值处理方法
处理异常值的方法包括但不限于以下几种:
- **删除异常值**: 如果异常值不影响研究目标,可以考虑直接删除这些值。
- **修正异常值**: 如果异常值是由于明显的错误造成的,可以尝试使用合适的方法修正这些值。
- **保留异常值**: 如果异常值是数据集的重要部分,可以考虑保留这些值,或者在分析时进行特殊处理。
```python
# 删除异常值所在行
df_cleaned = df[~((df['column'] < lower_bound) | (df['column'] > upper_bound))]
```
在此代码片段中,我们使用了布尔索引来过滤掉异常值所在的行,从而得到一个清理后的数据集。
## 2.3 数据类型转换
### 2.3.1 字符串与数值转换
在数据集中,某些特征可能是以字符串形式存在的,但为了模型训练需要转换成数值型。常见的字符串与数值转换包括编码技术、标签化等。
```python
# 将字符串类别转换为数值
df['categorical_column'] = df['categorical_column'].astype('category').cat.codes
```
在该代码片段中,我们使用了Pandas的`astype`方法和`cat.codes`属性来将分类数据转换为数值型。这是一种非常常见的类型转换方式。
### 2.3.2 分类数据的编码技术
分类数据的编码通常涉及到将类别型特征转换为模型能够理解的数值型特征。这包括:
- **标签编码(Label Encoding)**: 将每个类别分配一个唯一的整数。
- **独热编码(One-hot Encoding)**: 为每个类别创建一个新的二进制特征列。
- **二进制编码(Binary Encoding)**: 将标签编码转换成二进制形式。
```python
from sklearn.preprocessing import OneHotEncoder
# 创建独热编码器实例
enc = OneHotEncoder()
# 将分类数据转换为独热编码
encoded_data = enc.fit_transform(df[['categorical_column']])
```
在上述代码中,我们使用了Scikit-learn库中的`OneHotEncoder`类来将分类数据转换为独热编码格式。这是一种在处理分类数据时常用的技术。
## 2.4 数据标准化与归一化
### 2.4.1 标准化方法
标准化是将特征值缩放到一个标准正态分布的过程,即均值为0,标准差为1。标准化对于许多机器学习算法来说是重要的预处理步骤。
```python
from sklearn.preprocessing import StandardScaler
# 创建标准化器实例
scaler = StandardScaler()
# 对数据集进行标准化
df_scaled = scaler.fit_transform(df[['numeric_column']])
```
上述代码使用了Scikit-learn的`StandardScaler`类对指定数值列进行标准化处理。标准化之后的数据能够帮助模型更好地收敛。
### 2.4.2 归一化技巧
归一化是将特征值缩放到一个小的特定区间,通常是[0, 1],或者[-1, 1]。在一些特定算法中,如神经网络和k-最近邻,归一化是非常关键的。
```python
from sklearn.preprocessing import MinMaxScaler
# 创建归一化器实例
min_max_scaler = MinMaxScaler()
# 对数据集进行归一化处理
df_normalized = min_max_scaler.fit_transform(df[['numeric_column']])
```
在上述代码中,使用了Scikit-learn的`MinMaxScaler`类对指定的数值列进行归一化处理。归一化之后的数据分布在一个固定的区间内,有助于算法的稳定性和收敛性。
在本章节中,我们详细讲解了数据清洗过程中涉及的多项关键技术,包括缺失值处理、异常值检测与处理、数据类型转换、数据标准化与归一化。理解并掌握这些技术对于保证数据质量至关重要,并且它们将在后续的数据分析和建模过程中发挥关键作用。
```
# 3. 数据特征工程技术
## 3.1 特征提取基础
### 3.1.1 主成分分析(PCA)
主成分分析(PCA)是一种统计方法,通过正交变换将可能相关的变量转换成一组线性不相关的变量,称为主成分。在多变量分析中,它常用于降维,即减少数据集中的特征数量,同时尽可能保留数据的原始结构和信息。
```python
import numpy as np
import matplotlib.pyplot as plt
from sklearn.decomposition import PCA
from sklearn.preprocessing import StandardScaler
# 假设我们有以下数据集
X = np.array([[1, 2], [3, 4], [5, 6]])
# 对数据进行标准化处理
scaler = StandardScaler()
X_scaled = scaler.fit_transform(X)
# 应用PCA
pca = PCA(n_components=2)
X_pca = pca.fit_transform(X_scaled)
# 显示原始数据和PCA后的数据
plt.scatter(X_scaled[:, 0], X_scaled[:, 1], label='Original Data')
plt.scatter(X_pca[:, 0], X_pca[:, 1], color='r', label='PCA Data')
plt.legend()
plt.show()
# 输出主成分
print('主成分方向:', ***ponents_)
print('主成分方差解释率:', pca.explained_variance_ratio_)
```
在上述代码中,我们首先对数据进行了标准化处理,以确保PCA可以正确地找到数据的主成分。然后,我们初始化PCA并拟合数据,将原始数据集转换为新的主成分表示。通过输出主成分方向和方差解释率,我们可以理解PCA在数据降维中如何工作以及每个主成分的重要性。
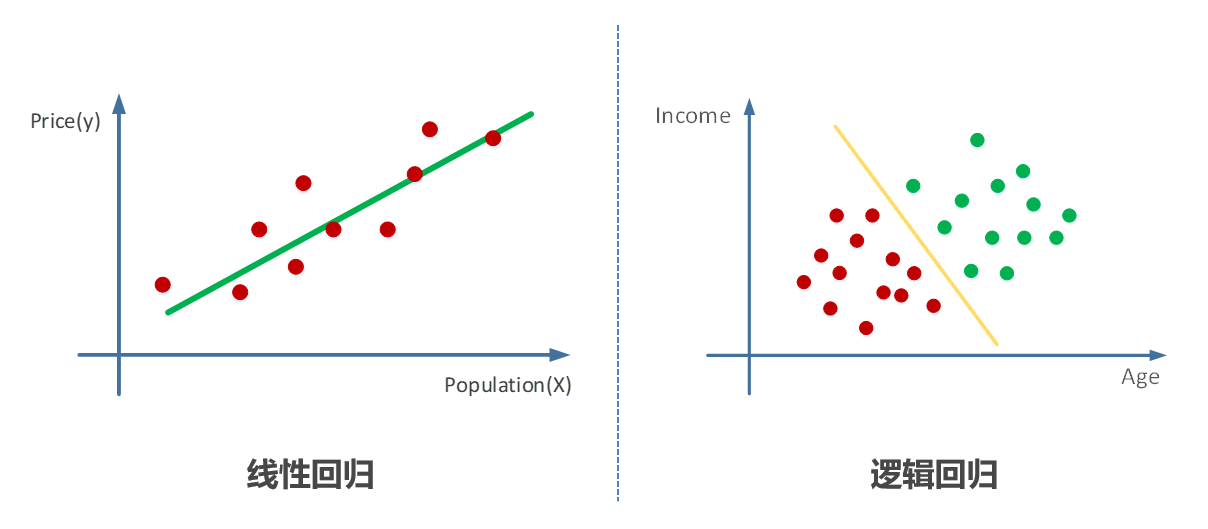
### 3.1.2 线性判别分析(LDA)
线性判别分析(LDA)是一种分类算法,用于在数据集中区分不同类别的数据点。LDA尝试找到一个线性组合的特征,这个线性组合可以最大化不同类之间的距离,并同时最小化同类之间的距离。这使得LDA不仅用于特征提取,还用于分类。
```python
from sklearn.discriminant_analysis import LinearDiscriminantAnalysis
# 假设X和Y分别代表不同的类别数据
X = np.array([[1, 2], [3, 4], [5, 6]])
Y = np.array([1, 2, 1])
# 应用LDA
lda = LinearDiscriminantAnalysis(n_components=1)
X_lda = lda.fit_transform(X, Y)
# 显示LDA后的数据
plt.scatter(X[:, 0], X[:, 1], c=Y, cmap='rainbow', label='Original Data')
plt.scatter(X_lda[:, 0], np.zeros((3, 1)), color='red', label='LDA Data')
plt.legend()
plt.show()
# 输出LDA方向
print('LDA方向:', lda.coef_)
```
通过上述代码,我们对数据进行了LDA分析,并将数据投影到一维空间中。这种降维方式使得数据更加适合进行线性分类。通过可视化和输出LDA方向,我们可以看到LDA如何优化数据的可分性。
## 3.2 特征构造方法
### 3.2.1 基于聚合的方法
在机器学习中,特征构造是增加模型预测能力的一种重要方式。基于聚合的方法涉及将原始数据的多个特征合并成一个新的特征,以表示更复杂的数据关系或模式。常见的聚合方法包括取最大值、最小值、平均值、中位数等。
```python
import pandas as pd
# 创建一个简单的DataFrame作为示例数据
df = pd.DataFrame({
'feature1': [1, 3, 5],
'feature2': [2, 4, 6]
})
# 应用聚合函数
df['max_feature'] = df[['feature1', 'f
```

 百万级
高质量VIP文章无限畅学
百万级
高质量VIP文章无限畅学
 千万级
优质资源任意下载
千万级
优质资源任意下载
 C知道
免费提问 ( 生成式Al产品 )
C知道
免费提问 ( 生成式Al产品 )
0
0
相关推荐

专栏简介
欢迎来到 Python 数据挖掘算法教程专栏!本专栏旨在帮助您掌握数据挖掘的核心算法,并将其应用于实际问题中。从构建您的第一个数据挖掘模型到使用 NLP 技术进行文本分析,再到社交网络和网络分析的深入研究,我们涵盖了广泛的主题。通过循序渐进的指南、案例研究和实战技巧,您将学习如何利用 Python 的强大功能来挖掘数据中的宝贵见解。无论是您是数据科学新手还是经验丰富的专业人士,本专栏都将为您提供在数据挖掘领域取得成功的必要知识和技能。
专栏目录
最低0.47元/天 解锁专栏
买1年送3月
百万级
高质量VIP文章无限畅学
千万级
优质资源任意下载
C知道
免费提问 ( 生成式Al产品 )
最新推荐
【Rose工具高级使用技巧】:让你的设计更上一层楼

# 摘要
本文全面介绍了Rose工具的入门知识、深入理解和高级模型设计。从基础的界面布局到UML图解和项目管理,再到高级的类图设计、行为建模以及架构组件图的优化,文章为读者提供了一个系统学习和掌握Rose工具的完整路径。此外,还探讨了Rose工具在代码生成、逆向工程以及协同工作和共享方面的应用,为软件工程师提供了一系列实践技巧和案例分析。文章旨在帮助读
【SAT文件实战指南】:快速诊断错误与优化性能,确保数据万无一失
+Error.jpg)
# 摘要
SAT文件作为一种重要的数据交换格式,在多个领域中被广泛应用,其正确性与性能直接影响系统的稳定性和效率。本文旨在深入解析SAT文件的基础知识,探讨其结构和常见错误类型,并介绍理论基础下的错误诊断方法。通过实践操作,文章将指导读者使用诊断工具进行错误定位和修复,并分析性能瓶颈,提供优化策略。最后,探讨SAT文件在实际应用中的维护方法,包括数据安全、备份和持
【MATLAB M_map数据可视化秘籍】:专家案例分析与实践最佳实践

# 摘要
本文详细介绍并演示了使用MATLAB及其M_map工具箱进行数据可视化和地图投影的高级应用。首先,对M_map工具进行了基础介绍,并概述了数据可视化的重要性及设计原则。接着,本研究深入探讨了M_map工具的地图投影理论与配置方法,包括投影类型的选择和自定义地图样式。文章进一步展示了通过M_map实现的多维数据可视化技巧,包括时间序列和空间
【高效旋转图像:DELPHI实现指南】:精通从基础到高级的旋转技巧

# 摘要
DELPHI编程语言为图像处理提供了丰富的功能和强大的支持,尤其是在图像旋转方面。本文首先介绍DELPHI图像处理的基础知识,然后深入探讨基础和高级图像旋转技术。文中详细阐述了图像类和对象的使用、基本图像旋转算法、性能优化方法,以及第三方库的应用。此外,文章还讨论了图像旋转在实际应用中的实现,包括用户界面的集成、多种图像格式支持以及自动化处理。针对疑难问
无线网络信号干扰:识别并解决测试中的秘密敌人!

# 摘要
无线网络信号干扰是影响无线通信质量与性能的关键问题,本文从理论基础、检测识别方法、应对策略以及实战案例四个方面深入探讨了无线信号干扰的各个方面。首先,本文概述了无线信号干扰的分类、机制及其对网络性能和安全的影响,并分析了不同无线网络标准中对干扰的管理和策略。其次,文章详细介绍了现场测试和软件工具在干扰检测与识别中的应用,并探讨了利用AI技术提升识别效率的潜力。然后
模拟与仿真专家:台达PLC在WPLSoft中的进阶技巧

# 摘要
本文全面介绍了台达PLC及WPLSoft编程环境,强调了WPLSoft编程基础与高级应用的重要性,以及模拟与仿真技巧在提升台达PLC性能中的关键作用。文章深入探讨了台达PLC在工业自动化和智能建筑等特定行业中的应用,并通过案例分析,展示了理论与实践的结合。此外,本文还展望了技术进步对台达PLC未来发展趋势的影响,包括工业物联网(IIoT)和人工智能(AI)技术的应用前景,并讨论了面临的挑战与机遇,提出
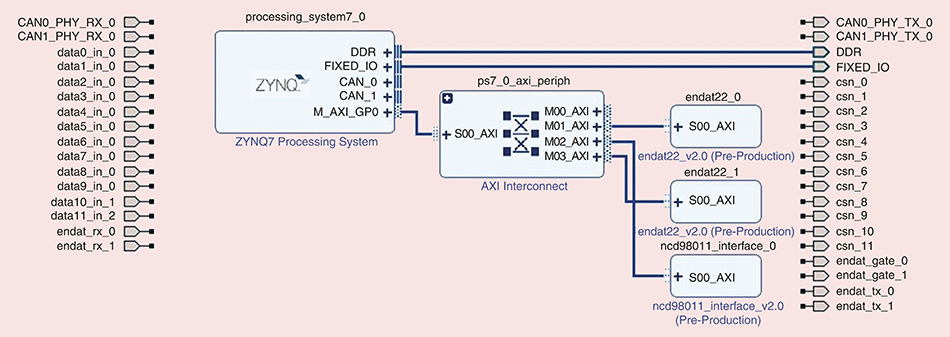
【ZYNQ外围设备驱动开发】:实现硬件与软件无缝对接的专家教程
# 摘要
ZYNQ平台是一种集成了ARM处理器和FPGA的异构处理系统,广泛应用于需要高性能和定制逻辑的应用场合。本文详细介绍了ZYNQ平台的软件架构和外围设备驱动开发的基础知识,包括硬件抽象层的作用、驱动程序与内核的关系以及开发工具的使用。同时,本文深入探讨了外围设备驱动实现的技术细节,如设
Calibre与Python脚本:自动化验证流程的最佳实践
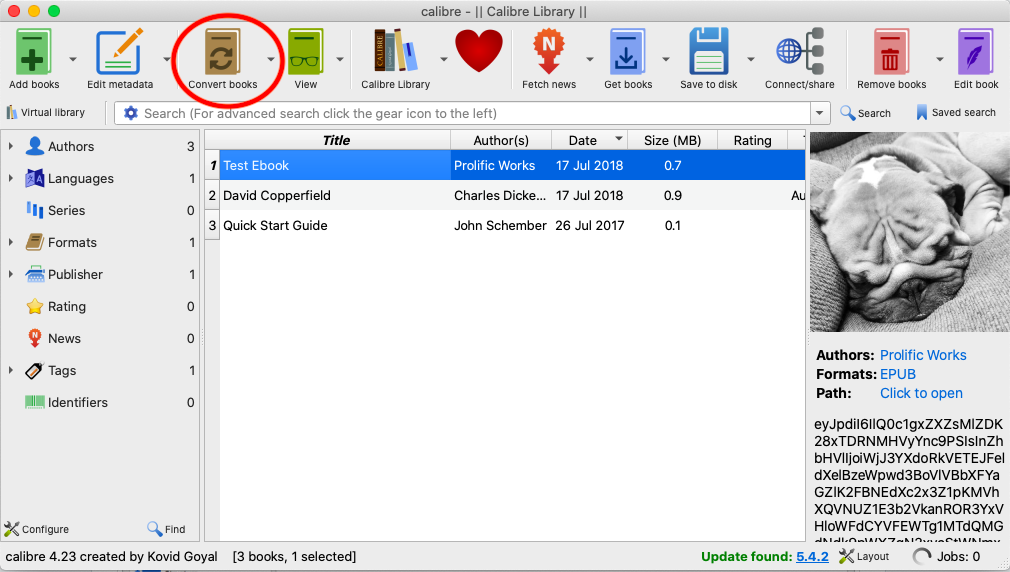
# 摘要
随着集成电路设计的复杂性日益增加,自动化验证流程的需求也在不断上升。本文首先介绍了Calibre和Python脚本集成的基础,探讨了Calibre的基本使用和自动化脚本编写的基础知识。接着,通过实践应用章节,深入分析了Calibre脚本在设计规则检查、版图对比和验证中的应用,以及Python脚本在自定义报告生
字符串处理的艺术:C语言字符数组与字符串函数的应用秘笈

# 摘要
C语言中的字符数组和字符串处理是基础且关键的部分,涉及到程序设计的许多核心概念。本文从基本概念出发,深
资源上传下载、课程学习等过程中有任何疑问或建议,欢迎提出宝贵意见哦~我们会及时处理!
点击此处反馈


专栏目录
最低0.47元/天 解锁专栏
买1年送3月
百万级
高质量VIP文章无限畅学
千万级
优质资源任意下载
C知道
免费提问 ( 生成式Al产品 )