std标准差助力数据建模:提升精度,增强鲁棒性
发布时间: 2024-07-14 22:09:00 阅读量: 65 订阅数: 49 

噪声鲁棒性:提升聚类分析质量的关键因素
# 1. 统计学基础:标准差的概念**
标准差是衡量数据集分散程度的重要统计指标。它表示数据点与平均值之间的平均距离,反映了数据的变异性。
标准差的计算公式为:
```
σ = √(Σ(x - μ)² / N)
```
其中:
* σ 表示标准差
* x 表示数据点
* μ 表示平均值
* N 表示数据点的数量
# 2. 标准差在数据建模中的应用
### 2.1 衡量数据分散程度
#### 2.1.1 标准差的定义和计算方法
标准差是衡量数据分散程度的重要指标,它反映了数据点与均值的距离。标准差的计算公式为:
```python
σ = sqrt(∑(x - μ)² / N)
```
其中:
* σ 为标准差
* x 为数据点
* μ 为均值
* N 为数据点的数量
#### 2.1.2 标准差与数据分布的关系
标准差与数据分布密切相关。正态分布是数据分布中最常见的类型,其标准差为 1。如果数据分布偏离正态分布,标准差将相应变化。
* **标准差较小:**数据分布集中,数据点靠近均值。
* **标准差较大:**数据分布分散,数据点离均值较远。
### 2.2 确定模型参数
标准差在确定模型参数中也发挥着重要作用。
#### 2.2.1 正态分布模型
在正态分布模型中,标准差 σ 决定了分布的形状。概率密度函数为:
```python
f(x) = (1 / (σ * sqrt(2π))) * exp(-(x - μ)² / (2σ²))
```
其中:
* f(x) 为概率密度函数
* μ 为均值
* σ 为标准差
#### 2.2.2 其他分布模型
除了正态分布外,标准差还用于其他分布模型中,如:
* **均匀分布:**标准差为 (b - a) / 2,其中 a 和 b 为分布范围。
* **指数分布:**标准差为 λ⁻¹, 其中 λ 为分布参数。
* **泊松分布:**标准差为 sqrt(λ),其中 λ 为分布参数。
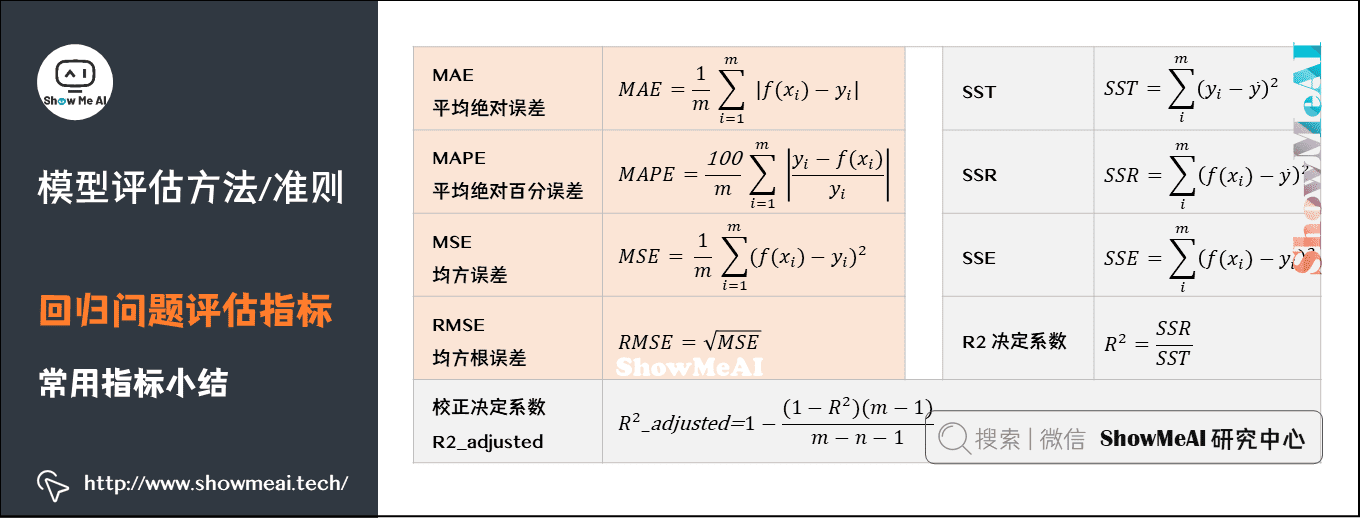
# 3. 标准差在模型评估中的作用
标准差在数据建模中扮演着至关重要的角色,不仅用于衡量数据分散程度和确定模型参数,还广泛应用于模型评估中。本章节将探讨标准差在评估模型拟合度和预测能力方面的作用,并提供具体的操作步骤和示例。
### 3.1 模型拟合度的评估
模型拟合度衡量模型对训练数据的拟合程度,是评估模型有效性的关键指标。标准差可用于评估模型拟合度,通过以下两种方式:
#### 3.1.1 残差分析
残差是实际值与预测值之间的差值,反映了模型的预测误差。标准差可用于计算残差的分布,从而评估模型的拟合度。较小的标准差表明残差分布集中,模型拟合度较高;较大的标准差则表明残差分布分散,模型拟合度较差。
**代码块:**
```python
import numpy as np
from sklearn.linear_model import LinearRegression
# 拟合线性回归模型
model = LinearRegression()
model.fit(X_train, y_train)
# 计算残差
residuals = y_train - model.predict(X_train)
# 计算残差的标准差
residual_std = np.std(residuals)
# 打印残差的标准差
print("残差的标准差:", residual_std)
```
**逻辑分析:**
该代码块使用 `numpy` 库计算残差的标准差,并打印结果。较小的 `residual_std` 值表明模型拟合度较高。
#### 3.1.2 R平方值
R平方值是衡量模型拟合度的一种常见指标,表示模型预测值与实际值之间的相关性。标准差可用于计算 R平方值,公式如下:
```
R^2 = 1 - (残差方差 / 总方差)
```
其中,残差方差是残差的平方和除以自由度,总方差是实际值平方和除以自由度。较高的 R平方值表明模型拟合度较好,而较低的

 百万级
高质量VIP文章无限畅学
百万级
高质量VIP文章无限畅学
 千万级
优质资源任意下载
千万级
优质资源任意下载
 C知道
免费提问 ( 生成式Al产品 )
C知道
免费提问 ( 生成式Al产品 )
0
0
相关推荐

专栏简介
《std标准差》专栏深入探讨了std标准差这一统计度量指标,揭示了其计算原理、局限性以及在广泛领域的应用场景。专栏内容涵盖了std标准差与均值、中位数、方差等度量指标的对比,在数据建模、机器学习、金融分析、质量控制、医疗保健、社会科学、图像处理、自然语言处理、推荐系统、供应链管理和网络安全等领域的应用。通过深入浅出的讲解和丰富的案例,专栏旨在帮助读者掌握std标准差的计算方法、理解其内涵,并探索其在各行各业中的实际应用,从而提升数据分析能力和决策制定水平。
专栏目录
最低0.47元/天 解锁专栏
买1年送3月
百万级
高质量VIP文章无限畅学
千万级
优质资源任意下载
C知道
免费提问 ( 生成式Al产品 )
最新推荐
JY01A直流无刷IC全攻略:深入理解与高效应用

# 摘要
本文详细介绍了JY01A直流无刷IC的设计、功能和应用。文章首先概述了直流无刷电机的工作原理及其关键参数,随后探讨了JY01A IC的功能特点以及与电机集成的应用。在实践操作方面,本文讲解了JY01A IC的硬件连接、编程控制,并通过具体
数据备份与恢复:中控BS架构考勤系统的策略与实施指南

# 摘要
在数字化时代,数据备份与恢复已成为保障企业信息系统稳定运行的重要组成部分。本文从理论基础和实践操作两个方面对中控BS架构考勤系统的数据备份与恢复进行深入探讨。文中首先阐述了数据备份的必要性及其对业务连续性的影响,进而详细介绍了不同备份类型的选择和备份周期的制定。随后,文章深入解析了数据恢复的原理与流程,并通过具体案例分析展示了恢复技术的实际应用。接着,本文探讨
【TongWeb7负载均衡秘笈】:确保请求高效分发的策略与实施
.webp)
# 摘要
本文从基础概念出发,对负载均衡进行了全面的分析和阐述。首先介绍了负载均衡的基本原理,然后详细探讨了不同的负载均衡策略及其算法,包括轮询、加权轮询、最少连接、加权最少连接、响应时间和动态调度算法。接着,文章着重解析了TongWeb7负载均衡技术的架构、安装配置、高级特性和应用案例。在实施案例部分,分析了高并发Web服务和云服务环境下负载
【Delphi性能调优】:加速进度条响应速度的10项策略分析

# 摘要
本论文首先概述了信号定位技术的基本概念和重要性,随后深入分析了三角测量和指纹定位两种主要技术的工作原理、实际应用以及各自的优势与不足。通过对三角测量定位模型的解析,我们了解到其理论基础、精度影响因素以及算法优化策略。指纹定位技术部分,则侧重于其理论框架、实际操作方法和应用场
【PID调试实战】:现场调校专家教你如何做到精准控制
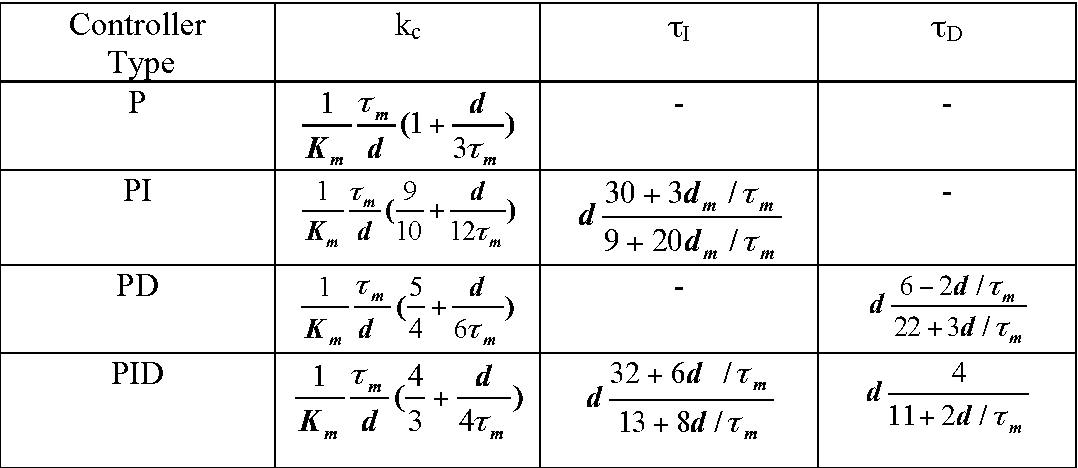
# 摘要
PID控制作为一种历史悠久的控制理论,一直广泛应用于工业自动化领域中。本文从基础理论讲起,详细分析了PID参数的理论分析与选择、调试实践技巧,并探讨了PID控制在多变量、模糊逻辑以及网络化和智能化方面的高级应用。通过案例分析,文章展示了PID控制在实际工业环境中的应用效果以及特殊环境下参数调整的策略。文章最后展望了PID控制技术的发展方
网络同步新境界:掌握G.7044标准中的ODU flex同步技术
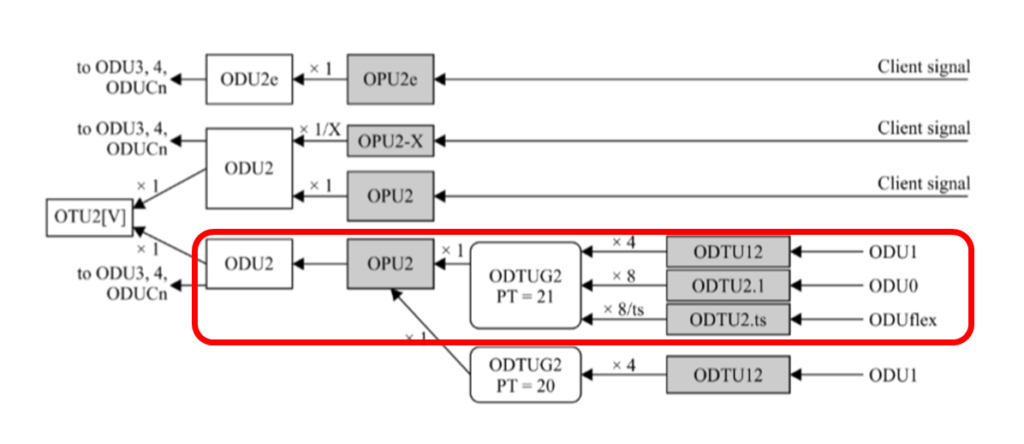
# 摘要
本文详细探讨了G.7044标准与ODU flex同步技术,首先介绍了该标准的技术原理,包括时钟同步的基础知识、G.7044标准框架及其起源与应用背景,以及ODU flex技术
字符串插入操作实战:insert函数的编写与优化
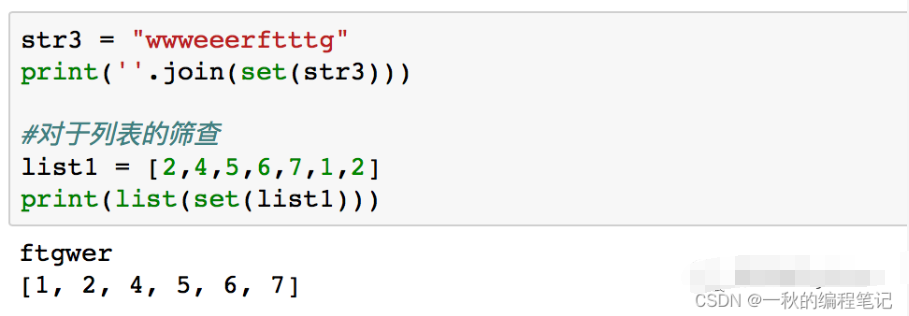
# 摘要
字符串插入操作是编程中常见且基础的任务,其效率直接影响程序的性能和可维护性。本文系统地探讨了字符串插入操作的理论基础、insert函数的编写原理、使用实践以及性能优化。首先,概述了insert函数的基本结构、关键算法和代码实现。接着,分析了在不同编程语言中insert函数的应用实践,并通过性能测试揭示了各种实现的差异。此外,本文还探讨了性能优化策略,包括内存使用和CPU效率提升,并介绍了高级数据结
环形菜单的兼容性处理

# 摘要
环形菜单作为一种用户界面元素,为软件和网页设计提供了新的交互体验。本文首先介绍了环形菜单的基本知识和设计理念,重点探讨了其通过HTML、CSS和JavaScript技术实现的方法和原理。然后,针对浏览器兼容性问题,提出了有效的解决方案,并讨论了如何通过测试和优化提升环形菜单的性能和用户体验。本
资源上传下载、课程学习等过程中有任何疑问或建议,欢迎提出宝贵意见哦~我们会及时处理!
点击此处反馈


专栏目录
最低0.47元/天 解锁专栏
买1年送3月
百万级
高质量VIP文章无限畅学
千万级
优质资源任意下载
C知道
免费提问 ( 生成式Al产品 )