Java中ceil函数的奥秘:揭示取整函数的编程之道
发布时间: 2024-07-12 15:30:38 阅读量: 56 订阅数: 27 

基于freeRTOS和STM32F103x的手机远程控制浴室温度系统设计源码
# 1. Java中取整函数概述**
Java中提供了丰富的取整函数,用于将浮点数转换为整数。其中,ceil函数是常用的取整函数之一,它将浮点数向上取整为最接近的整数。ceil函数的语法为:
```java
public static double ceil(double a)
```
其中,a为要取整的浮点数,返回值为取整后的整数。
# 2. ceil函数的理论基础
### 2.1 数学定义和几何解释
**数学定义:**
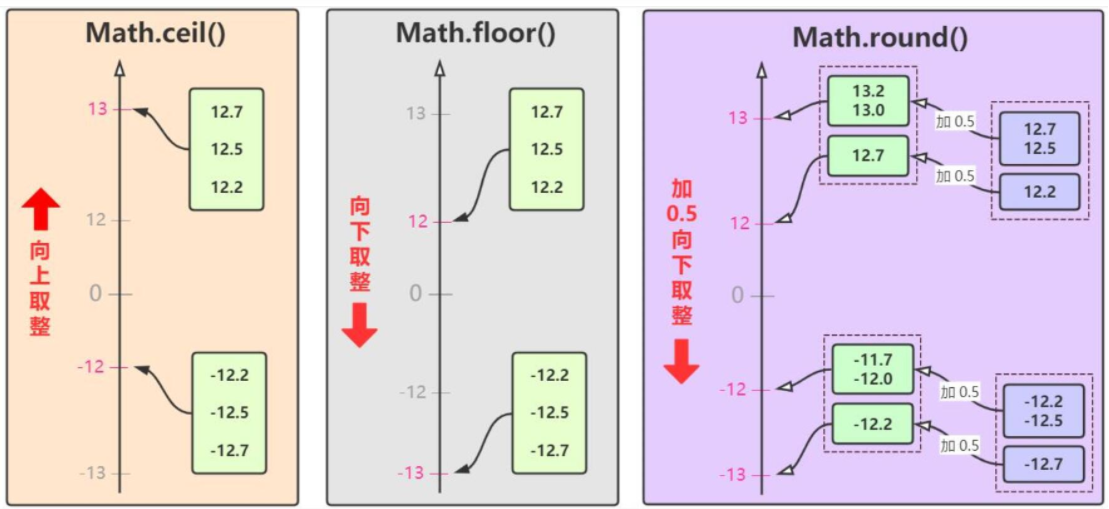
ceil函数(ceiling function)是数学中定义的一个函数,它将一个实数向上取整为最接近的整数。对于实数x,ceil(x)表示大于或等于x的最小整数。
**几何解释:**
在数轴上,ceil(x)可以解释为x向上取整到其上方的整数。例如,ceil(3.14) = 4,因为4是大于或等于3.14的最小整数。
### 2.2 浮点数表示和舍入误差
在计算机中,浮点数用于表示实数。浮点数使用科学计数法表示,由尾数、指数和基数组成。
**浮点数表示:**
```
浮点数 = 尾数 * 基数^指数
```
**舍入误差:**
由于计算机内存有限,浮点数的尾数只能存储有限位数。当尾数超过存储容量时,需要进行舍入。舍入误差是指实际值与舍入后值的差值。
**ceil函数的舍入:**
ceil函数使用向正无穷大方向舍入的策略。这意味着,当浮点数的尾数为正时,舍入到下一个整数;当尾数为负时,舍入到当前整数。
**代码块:**
```java
double x = 3.14;
double ceilX = Math.ceil(x);
System.out.println("ceil(3.14) = " + ceilX); // 输出:ceil(3.14) = 4.0
```
**逻辑分析:**
代码块将浮点数x赋值为3.14,然后使用Math.ceil()方法计算其向上取整结果,并将其存储在变量ceilX中。最后,打印出ceilX的值。
**参数说明:**
* Math.ceil(x):计算实数x的向上取整结果。
# 3. ceil函数的实践应用
### 3.1 基本用法和返回值
`ceil`函数的基本用法非常简单,它接受一个浮点数参数,并返回大于或等于该参数的最小整数。其语法如下:
```java
public static double ceil(double a)
```
其中,`a`为输入的浮点数。
`ceil`函数的返回值是一个`double`类型的整数,它表示大于或等于`a`的最小整数。例如:
```java
System.out.println(Math.ceil(3.14)); // 输出:4.0
System.out.println(Math.ceil(-2.71)); // 输出:-2.0
```
### 3.2 常见场景和编程示例
`ceil`函数在实际编程中有着广泛的应用,以下是一些常见的场景:
**1. 金融计算:**在金融计算中,`ceil`函数可用于计算利息、汇率等需要向上取整的数值。例如:
```java
double interestRate = 0.05;
do
```

 百万级
高质量VIP文章无限畅学
百万级
高质量VIP文章无限畅学
 千万级
优质资源任意下载
千万级
优质资源任意下载
 C知道
免费提问 ( 生成式Al产品 )
C知道
免费提问 ( 生成式Al产品 )
0
0
相关推荐

专栏简介
欢迎来到我们的专栏,我们将深入探讨 ceil 函数在各种编程语言和数据库中的奥秘。从数学概念到实际应用,我们将揭示 ceil 函数的取整魔力。
我们将探索 MySQL、SQL Server、Oracle、PostgreSQL、MongoDB、Redis、Elasticsearch、Spark SQL、Hadoop、Python、Java、C#、JavaScript、PHP 和 R 语言中 ceil 函数的妙用。通过深入的指南和示例,您将掌握取整函数的无限可能,巧妙地解决数据取整难题,并提高您的编程和数据分析技能。
专栏目录
最低0.47元/天 解锁专栏
买1年送3月
百万级
高质量VIP文章无限畅学
千万级
优质资源任意下载
C知道
免费提问 ( 生成式Al产品 )
最新推荐
【NRSEC3000芯片架构深度剖析】:揭秘硬件加密原理的5大核心

# 摘要
本文详细介绍了NRSEC3000芯片的架构、安全基础、核心组件和加密技术。首先,概述了NRSEC3000的芯片架构,随后深入探讨了其安全基础,包括硬件加密的理论基础以及安全启动与引导过程。文章进一步解析了核心组件,重点分析了核心处理器单元、专用安全模块和内存管理与保护机制。接着,文章探讨了NRSEC3000芯片的加密
金蝶云星空技巧大公开
# 摘要
金蝶云星空是一款集成了财务管理、供应链管理及销售管理等核心功能的企业资源规划(ERP)云服务产品。该系统通过优化财务模块、自动化销售流程和库存管理,为企业提供了全面的业务支持和决策辅助工具。本文详细解析了金蝶云星空的核心功能,并通过实践案例分析,探讨了其在中小企业中的应用策略以及特定行业解决方案的实施效果。同时,本文还介绍了金蝶云星空的高级技巧、维护策略,并展望了其在云计算、人工智能、移动办公等前沿技术的结合应用前景。通过效率监控和
Paddle Fluid性能优化:性能调优全攻略
# 摘要
本文对Paddle Fluid性能优化进行全面概述,涵盖理论基础、性能瓶颈剖析以及实践中的调优技巧。首先介绍了Paddle Fluid的架构和基本理论,随后深入分析了模型结构优化、数据处理和并行计算等多个性能瓶颈问题,并探讨了解决方案。文中还介绍了性能调优的工具和API使用技巧、编译器优化以及内存管理策略,并通过实际案例展示调优效果。最后,展望了Paddle
【C#键盘事件处理全攻略】:从新手到专家的10大技巧
# 摘要
本论文深入探讨了C#中键盘事件处理的各个方面,从基础概念到高级技巧,再到实际应用案例与性能优化。首先介绍了C#键盘事件处理的基础知识,随后详细阐述了键盘事件的分类、特性、关键概念、捕获与冒泡机制。接着,论文分享了在非UI线程中处理键盘事件、组合键的识别与高级模拟的技巧。通过游戏开发、文本编辑器、辅助工具等实际案例,展示了键盘事件处理的多样化应用。此外,本论文还分析了键盘事件处理的性能问题,并提供了调试技巧。最后,展望了跨平台开发中键盘事件处理的挑战和未来趋势,包括新技术的融合应用。本文旨在为C#开发者提供全面的键盘事件处理指南,提升编程效率和应用性能。
# 关键字
C#;键盘事件;
【MSP430 FFT算法:现场操作手册】:硬件协同与软件实战演练
# 摘要
本文介绍了MSP430微控制器结合快速傅里叶变换(FFT)算法的理论知识、硬件准备、软件实现与应用实践。首先概述了MSP430微控制器的核心特性和FFT算法的数学基础及其优势。接着,详细探讨了在
CAPL脚本初体验:编写你的第一个测试脚本(入门篇二)
# 摘要
CAPL(CAN Access Programming Language)是一种专门用于CAN(Controller Area Network)通信仿真的脚本语言,广泛应用于汽车电子和自动化领域。本文从CAPL脚本的基本概念和环境搭建开始,逐步深入到基础语法、函数使用以及调试技巧,详细介绍了如何利用CAPL进行高效的事件处理、节点操作和仿真测试。进而,本文探讨了CAPL脚本的进阶应
数据库性能调优的艺术:ADVISOR2002实战技巧全收录
# 摘要
数据库性能调优是确保信息系统高效运行的关键环节,本文首先概述了性能调优的重要性以及基本的原则和步骤。随后,详细介绍了ADVISOR2002的架构、安装和配置,以及如何使用它进行性能监控和故障诊断。通过解析关键性能指标、监控实时数据流和设置告警策略,ADVISOR2002助力用户发现并解决性能瓶颈问题。文章的实践章节通过案例研究展示了如何制定和执行调优策略,并对调优效果进行评估,从而实现数据库性能的持续改进。本文为
【Karel与Java整合秘籍】:掌握双语言编程的强大桥梁
-Concept-in-Java.webp)
# 摘要
本文探讨了Karel语言与Java语言的整合过程,从基础概念到深入应用,揭示了两者的集成和相互作用方式。首先介绍了Karel和Java的基础知识,并说明了它们如何初步结合,包括环境配置和基本编程概念的映射。接着,深入分析了如何将Karel的对象和类、控制结构和事件驱动编程技术
【SimVision-NC Verilog高效转换技巧】:设计流程的关键加速步骤

# 摘要
本文以SimVision-NC Verilog为研究对象,全面系统地介绍了其基础语法和高效转换技巧。首先,深入讲解了Verilog的基础知识,包括语法、数据类型、模块化设计原则,以及仿真流程和优化设计的关键点。接下来,通过实践案例,详细阐述了SimVision-NC转换工具的使用方法、高级技巧和常见问题的解决策略。文章还通过实例剖析,展示了如何设置和优化实际项目。最后,展望了
资源上传下载、课程学习等过程中有任何疑问或建议,欢迎提出宝贵意见哦~我们会及时处理!
点击此处反馈


专栏目录
最低0.47元/天 解锁专栏
买1年送3月
百万级
高质量VIP文章无限畅学
千万级
优质资源任意下载
C知道
免费提问 ( 生成式Al产品 )