MATLAB中ceil函数的探索:领略取整函数的数学计算魅力
发布时间: 2024-07-12 15:44:27 阅读量: 83 订阅数: 30 

混合四策略改进SSA优化算法:MISSA的实证研究与应用展望 经过融合spm映射、自适应-正余弦算法、levy机制、步长因子动态调整四种策略的改进,MISSA算法测试结果惊艳,麻雀飞天变凤凰 目前相

# 1. ceil函数的数学基础**
ceil函数是一个取整函数,它将输入值向上取整到最接近的整数。其数学定义如下:
```
ceil(x) = smallest integer greater than or equal to x
```
换句话说,ceil函数返回大于或等于输入值x的最小整数。例如,ceil(3.14) = 4,ceil(-2.71) = -2。
# 2. ceil函数在MATLAB中的应用
### 2.1 ceil函数的基本语法和用法
#### 2.1.1 ceil函数的定义和作用
`ceil`函数是一个MATLAB内置函数,用于计算输入数值的上取整,即返回大于或等于输入数值的最小整数。`ceil`函数的语法格式为:
```
y = ceil(x)
```
其中:
* `x`:输入数值,可以是标量、向量或矩阵。
* `y`:输出结果,与`x`具有相同的大小和类型。
#### 2.1.2 ceil函数的参数和返回值
`ceil`函数只有一个输入参数,即需要取整的数值。函数的返回值与输入参数具有相同的大小和类型,表示输入数值的上取整结果。
例如:
```
x = [1.2, 3.5, -2.1, 0];
y = ceil(x)
```
输出结果为:
```
y = [2, 4, -2, 0]
```
### 2.2 ceil函数的进阶应用
#### 2.2.1 ceil函数与舍入函数round的区别
`ceil`函数与另一个MATLAB内置函数`round`类似,都用于数值取整。但是,这两个函数在取整规则上有所不同。`ceil`函数总是向上取整,而`round`函数根据输入数值的小数部分是否大于或等于0.5来决定向上或向下取整。
例如:
```
x = [1.2, 3.5, -2.1, 0];
y = ceil(x)
z = round(x)
```
输出结果为:
```
y = [2, 4, -2, 0]
z = [1, 4, -2, 0]
```
#### 2.2.2 ceil函数在数值分析中的应用
`ceil`函数在数值分析中具有广泛的应用,例如:
* **舍入误差分析:**`ceil`函数可以用来计算数值计算中的舍入误差,即由于有限精度导致的实际结果与理论结果之间的差异。
* **区间估计:**`ceil`函数可以用来估计数值的范围或区间,例如,可以用来计算函数在某个区间内的最大值。
* **离散化:**`ceil`函数可以用来将连续数值离散化为整数,例如,可以用来将连续时间信号转换为离散时间信号。
# 3. ceil函数的实践案例
### 3.1 ceil函数在图像处理中的应用
#### 3.1.1 图像尺寸的调整
ceil函数在图像处理中可以用于调整图像的尺寸。通过使用ceil函数,我们可以将图像的尺寸向上取整为指定的大小。这在图像缩放和裁剪等操作中非常有用。
```
% 读取图像
image = imread('image.jpg');
% 获取图像的原始尺寸
original_size = size(image);
% 指定新的图像尺寸
new_size = [512, 512];
% 使用ceil函数调整图像尺寸
new_image = imresize(image, new_size);
% 显示调整后的图像
figure;
imshow(new_image);
```
#### 3.1.2 图像灰度值的量化
ceil函数还可以用于量化图像的灰度值。量化是指将连续的灰度值范围离散化为有限的几个等级。这在图像压缩和增强等操作中非常有用。
```
% 读取图像
image = imread('image.jpg');
% 获取图像的灰度值范围
min_value = min(image(:));
```

 百万级
高质量VIP文章无限畅学
百万级
高质量VIP文章无限畅学
 千万级
优质资源任意下载
千万级
优质资源任意下载
 C知道
免费提问 ( 生成式Al产品 )
C知道
免费提问 ( 生成式Al产品 )
0
0
相关推荐

专栏简介
欢迎来到我们的专栏,我们将深入探讨 ceil 函数在各种编程语言和数据库中的奥秘。从数学概念到实际应用,我们将揭示 ceil 函数的取整魔力。
我们将探索 MySQL、SQL Server、Oracle、PostgreSQL、MongoDB、Redis、Elasticsearch、Spark SQL、Hadoop、Python、Java、C#、JavaScript、PHP 和 R 语言中 ceil 函数的妙用。通过深入的指南和示例,您将掌握取整函数的无限可能,巧妙地解决数据取整难题,并提高您的编程和数据分析技能。
专栏目录
最低0.47元/天 解锁专栏
买1年送3月
百万级
高质量VIP文章无限畅学
千万级
优质资源任意下载
C知道
免费提问 ( 生成式Al产品 )
最新推荐
Thaiphoon Burner 7.1.1.0故障排除指南

# 摘要
Thaiphoon Burner是一款内存信息编辑工具,广泛用于故障排查和硬件兼容性调整。本文综合介绍了Thaiphoon Burner的基本概念、故障诊断前的准备工作、故障诊断技巧、软件和硬件故障处理,以及高级故障排除技巧。文章详细阐述了硬件检查、软件环境设置、数据备份的重要性,解释了
【IBM V7000性能优化秘籍】:深入解析,全面提升存储性能!
# 摘要
本文针对IBM V7000存储系统进行了全面的性能优化分析。首先概述了存储系统的结构和关键性能指标,然后深入探讨了优化存储性能的理论基础,包括性能瓶颈分析和资源管理策略。在硬件层面,本文详细介绍了配置最佳实践、管理存储阵列的技巧,以及硬件升级和维护的策略。软件层面的优化涉及到存储池和卷、文件系统、数据管理以及系统监控和故障排除。最后,
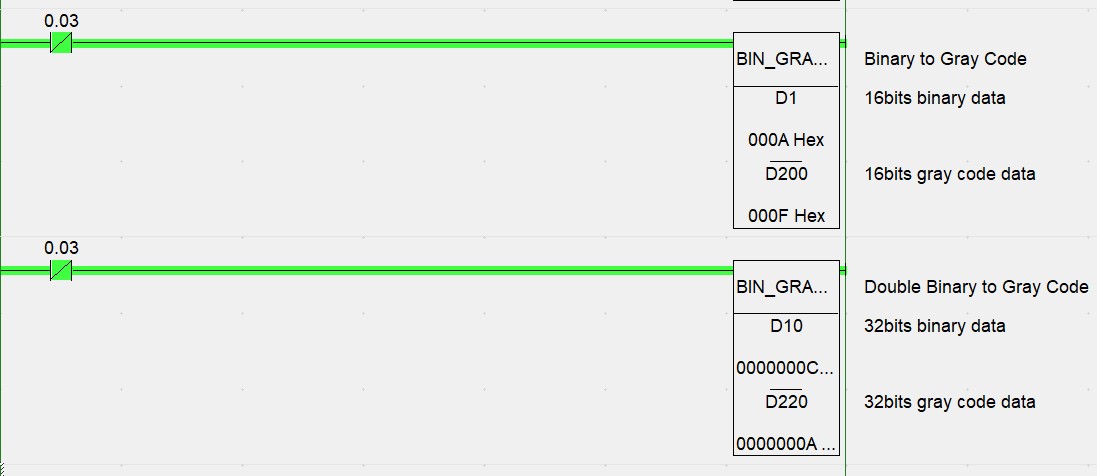
【欧姆龙PLC编程进阶】:高级指令应用详解
# 摘要
本文回顾了欧姆龙PLC(可编程逻辑控制器)编程的基础知识,并深入探讨了高级指令的理论基础与分类。章节内容涵盖数据处理、控制类高级指令及其在实现复杂逻辑控制、数据处理和运动控制中的应用实例。文章还讨论了高级指令的调试技巧、性能优化和错误处理方法。最后,通过案例研究,分析了高级指令在工业自动化和智
内存管理与资源释放策略:CANoe .NET编程进阶指南

# 摘要
本文首先概述了内存管理的基础知识,并介绍了CANoe .NET环境下的内存管理机制。通过深入探讨内存管理的理论基础,包括内存分配、释放、垃圾回收以及内存泄漏的诊断与优化策略,本文强调了资源管理在软件开发中的重要性。同时,文章详细分析了在CANoe .NET环境下如何实施资源自动管理以及手动释放的最佳实践,以及如何使用监控工具预防和修复内存泄漏。此外,本
【移动导航应用开发:用户体验优化10大策略】:专家分享

# 摘要
本文从用户需求分析、界面设计优化、功能优化、性能与稳定性提升、用户反馈处理以及未来趋势探索等多个维度,系统地探讨了移动导航应用的开发与优化。通过对用户心理和操作习惯的研究,本文提出界面设计应遵循简洁性和直觉操作原则,并强调颜色、图标和文字等设计元素的易用性。在功能优化方面,本文探讨了实时路况更新、个性化路线规划和离线导
信息管理系统开发实战:敏捷与传统方法的完美融合
# 摘要
随着信息技术的快速发展,信息管理系统开发方法论也在不断演变。本文首先概述了信息管理系统开发的基本概念,随后深入探讨了敏捷开发方法论的核心价值观与原则,技术实践如测试驱动开发(TDD)、持续集成与持续部署(CI/CD)、用户故事和敏捷迭代等,以及敏捷项目管理工具与方法。接着,本文分析了传统开发方法的模型、项目管理和质量保证手段,以及相关开发工具和
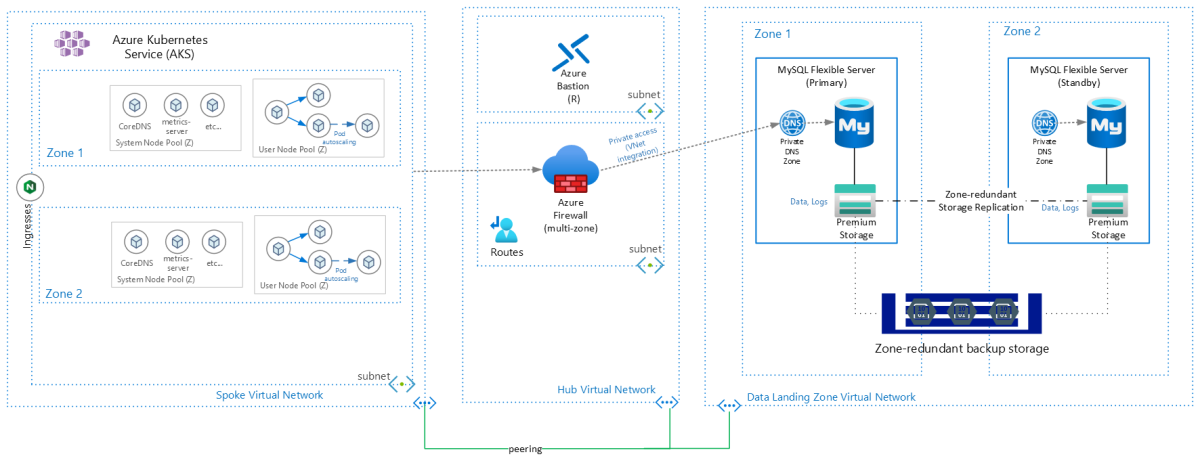
【云服务下的运输配置】:提升配置灵活性的云原生实践
# 摘要
云服务与运输配置已成为现代信息技术架构的核心组成部分,对企业的敏捷性和竞争力具有显著影响。本文首先介绍了云服务的架构及其关键特点,对比了IaaS, PaaS, SaaS等不同服务模型。随后,本文探讨了云原生配置管理理论,着重于其关键概念、优势以及在敏捷性、可扩展性方面的贡献。接着,通过分析
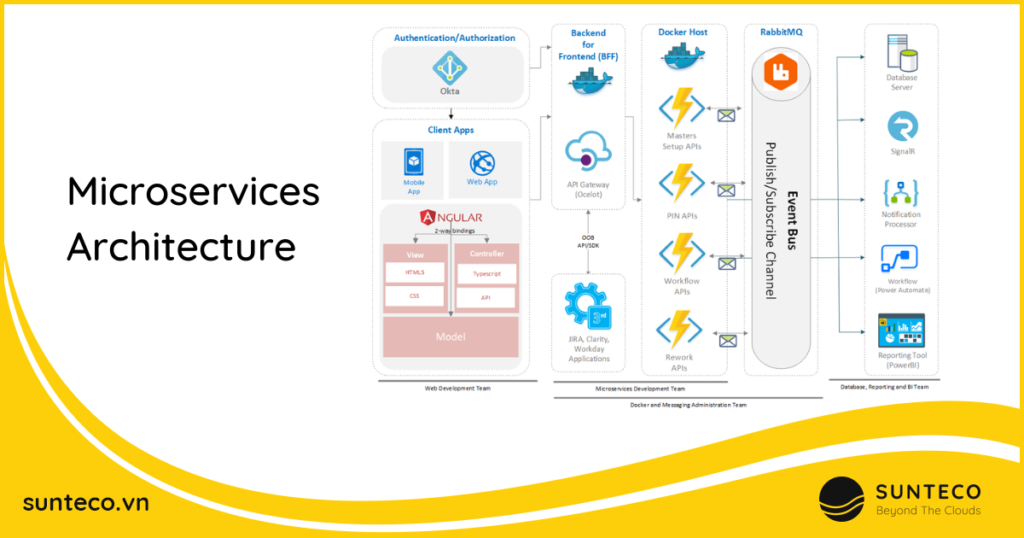
【企业应用集成(EAI)完全攻略】:新手入门到高级实践
# 摘要
企业应用集成(EAI)是企业信息化发展的关键环节,通过集成不同的企业应用,实现业务流程的高效协同与数据的一致性。本文从EAI的概念、理论基础讲起,深入分析了EAI的核心集成模式、数据转换与映射技术。接着,探讨了EAI中间件技术、集成工具以及企业服务总线(ESB)的实践应用。文章进一步结合业务流程管理(BPM)、
【Mockito与Spring Boot无缝集成】:简化测试配置的黄金法则

# 摘要
本文详细探讨了Mockito与Spring Boot集成的过程及其在软件测试中的应用,为开发人员提供了一套完整的单元测试和集成测试策略。首先介绍了单元测试的基础知识和Mockito的基本使用方法,随后深入讲解了在Spring Boot
GAMIT数据处理基础:快速掌握GAMIT的使用技巧(10个步骤让你成为专家)

# 摘要
本文深入介绍了GAMIT数据处理软件的基础知识、安装配置、基础操作流程以及高级操作技巧。首先,概述了GAMIT数据处理的基本概念和系统需求,并详细说明了安装步骤、文件类型和目录结构。随后,本文阐述了GAMIT的基础操作流程,包括数据的准备、预处理、处理与分析,以及结果的输出与后处理。进阶内容涵盖了自定义模型、参数调整、处理策略优化以及脚本自动化和批处理。最后,通
资源上传下载、课程学习等过程中有任何疑问或建议,欢迎提出宝贵意见哦~我们会及时处理!
点击此处反馈


专栏目录
最低0.47元/天 解锁专栏
买1年送3月
百万级
高质量VIP文章无限畅学
千万级
优质资源任意下载
C知道
免费提问 ( 生成式Al产品 )