数据挖掘异常检测:9个方法与实践案例
发布时间: 2024-09-08 07:55:40 阅读量: 214 订阅数: 69 

数据挖掘导论(完整版)_数据挖掘_异常检测_
# 1. 数据挖掘中的异常检测基础
在数据挖掘的广阔世界中,异常检测始终是一个充满挑战且至关重要的研究领域。它是识别数据集中不一致或罕见模式的过程,这些模式通常与常规数据的行为大相径庭,可能暗示着隐藏的复杂问题或机遇。异常检测的应用广泛,覆盖了从信用卡欺诈预防到网络安全防护的多个方面。本章将带你了解异常检测的基础知识,包括其定义、重要性以及为何数据科学家和分析师必须对它有深入的了解。随后,我们将深入探讨异常检测的理论基础和方法,为你打下坚实的知识基础,为接下来章节中的案例分析和高级技术讨论做准备。
# 2. 理论基础与异常检测方法
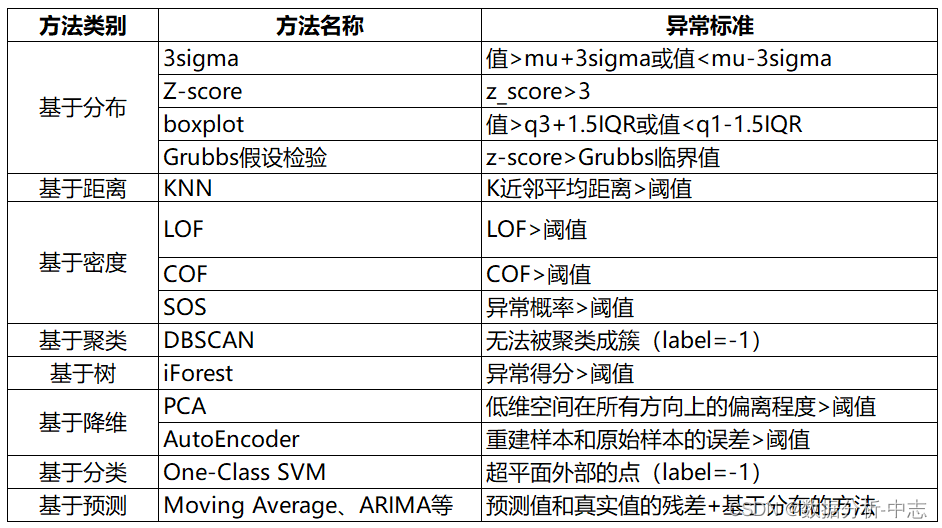
### 2.1 统计学方法
统计学方法是异常检测领域中的经典方法,它们通常依赖于数据的概率分布模型,并将不符合这种模型的数据点标记为异常。在这部分中,我们将深入探讨基于概率分布的异常检测和聚类异常检测技术。
#### 2.1.1 基于概率分布的异常检测
基于概率分布的异常检测假设数据遵循某种已知的统计分布,如高斯分布,然后计算数据点的概率值,并根据概率值的大小确定异常程度。一般而言,概率值较低的数据点更容易被视为异常。
```python
from scipy.stats import multivariate_normal
# 假设数据遵循多元正态分布,我们需要计算数据点的概率密度
def calculate_probability(data_point, mean, covariance):
return multivariate_normal.pdf(data_point, mean=mean, cov=covariance)
# 模拟一组数据点和一个异常点
data_points = np.random.multivariate_normal(mean=[0, 0], cov=[[1, 0], [0, 1]], size=100)
anomaly_point = np.array([-3, -3])
# 假设的均值和协方差矩阵(这里简化了计算过程)
mean = np.mean(data_points, axis=0)
covariance = np.cov(data_points, rowvar=False)
# 计算概率密度
data_point_probability = calculate_probability(anomaly_point, mean, covariance)
print(f"Probability of the anomaly point: {data_point_probability}")
```
在上述代码中,我们利用`scipy`库中的`multivariate_normal.pdf`函数来计算多元正态分布的概率密度。这种方法的关键在于正确估计数据的分布参数。在实际应用中,数据可能会偏离正态分布,因此,模型的选择和参数估计是这一方法成功与否的关键。
#### 2.1.2 聚类异常检测技术
聚类技术可以将数据分组为多个簇,簇内部数据点相似度较高,而与其它簇的数据点差异较大。异常点通常是那些不属于任何簇或者与所有簇的距离都很远的点。
```python
from sklearn.cluster import KMeans
# 使用 K-Means 算法进行聚类
kmeans = KMeans(n_clusters=3)
clusters = kmeans.fit_predict(data_points)
# 计算每个点到最近簇中心的距离,作为异常分数
distances = np.min([pairwise_distances(data_points, [kmeans.cluster_centers_[idx]]) for idx in range(3)], axis=0)
```
聚类异常检测技术的核心在于簇的数量选择和距离度量方式。选择不同的距离度量方法(如欧氏距离、曼哈顿距离)可能会影响到最终的聚类结果和异常点的判定。
### 2.2 机器学习方法
机器学习方法在异常检测中占据了重要位置,通过训练模型来学习数据的正常模式,并以此来检测偏离这一模式的异常数据点。
#### 2.2.1 基于分类的异常检测
基于分类的异常检测方法将异常检测转化为一个二分类问题,其中一个类别代表正常行为,另一个类别代表异常行为。该方法通常需要大量标注数据来训练分类器。
```python
from sklearn.ensemble import IsolationForest
# 假设我们有一个数据集和对应的标签
X_train, y_train = load_data_and_labels()
# 训练隔离森林模型作为分类器
clf = IsolationForest(n_estimators=100)
clf.fit(X_train, y_train)
# 预测新数据点的异常分数
anomalies = clf.predict(new_data_points)
```
在上述代码中,使用`IsolationForest`算法作为例子。需要注意的是,在实际应用中,标记的正常数据需要远多于异常数据,以防止模型偏向于将多数类别预测为正常。
#### 2.2.2 基于聚类的异常检测
基于聚类的异常检测是一种未监督学习方法,该方法通过聚类分析找出数据中的主要结构,然后将那些不属于任何簇的数据点视为异常。
```python
from sklearn.cluster import DBSCAN
# 应用 DBSCAN 算法进行聚类
dbscan = DBSCAN(eps=0.3, min_samples=10)
clusters = dbscan.fit_predict(data_points)
# 标记未被分配到簇的点为异常
is_anomaly = clusters == -1
```
代码中的`DBSCAN`算法是根据数据点的密度来进行聚类,参数`eps`和`min_samples`决定了簇的密度阈值。这种方法特别适用于有噪声的数据集,但需要谨慎选择参数以避免将正常点误判为异常。
### 2.3 高级分析方法
随着数据挖掘技术的不断进步,出现了更多先进的分析方法,它们能够处理更复杂和多维的数据集,其中孤立森林和基于密度的方法是两类较为流行的技术。
#### 2.3.1 孤立森林算法
孤立森林算法是一种基于树的模型,该算法通过随机选择特征和随机选择切分值来构建多棵隔离树,孤立的点会更早地被隔离出来,因此它们在树中的路径更短,这个路径长度被用来衡量异常程度。
```python
from sklearn.ensemble import IsolationForest
# 使用孤立森林算法进行异常检测
isolation_forest = IsolationForest(n_estimators=100, max_samples='auto', contamination=float(.01), max_features=1.0)
scores_pred = isolation_forest.fit_predict(data_points)
# 将孤立森林的负值视为异常点
anomalies = data_points[scores_pred == -1]
```
`IsolationForest`在数据点的异常程度预测上非常高效,尤其是在大数据集上,但如何选取`contamination`参数(异常点的比例)是一个挑战。在大多数情况下,该参数需要根据问题的上下文进行调整。
#### 2.3.2 基于密度的异常检测
基于密度的异常检测方法,例如局部异常因子(Local Outlier Factor,简称LOF)算法,根据数据点周围邻域的密度与其它区域的密度比较来判断异常程度。局部密度远小于其邻居的点被认为是异常。
```python
from sklearn.neighbors import LocalOutlierFactor
# 使用 LOF 算法进行异常检测
lof = LocalOutlierFactor(n_neighbors=20)
scores = lof.fit_predict(data_points)
# 将 LOF 的负值视为异常点
anomalies = data_points[scores == -1]
```
在使用`LocalOutlierFactor`时,参数`n_neighbors`需要根据数据集的密度进行调整。基于密度的方法能够检测出局部异常,这是其它方法所不具备的优势。
以上介绍的方法各有特点,选择合适的方法需要综合数据集的特性和业务需求。理解每种方法背后的原理及其适用场景,对于高效地解决异常检测问题至关重要。接下来,我们将进入第三章,通过实际案例来深入分析这些方法在不同领域的应用。
# 3. 异常检测实践案例分析
## 3.1 金融领域异常检测案例
### 3.1.1 信用卡欺诈检测
信用卡欺诈是金融领域中一个重大问题,利用异常检测技术可以有效地识别出潜在的欺诈行为。数据分析在信用卡欺诈检测中尤为重要,因为几乎所有的交易都可以被捕捉并进行分析。机器学习模型可以根据用户的历史交易行为进行训练,从而识别出异常模式。
例如,当一个用户突然在地理上远离其常用交易位置的地方进行了一笔大额交易时,模型便可以将其标记为可能的欺诈行为。在实践中,我们可以使用诸如随机森林、支持向量机(SVM)和集成学习方法(如梯度提升机GBM)等算法来构建信用卡欺诈检测模型。
```
```

 百万级
高质量VIP文章无限畅学
百万级
高质量VIP文章无限畅学
 千万级
优质资源任意下载
千万级
优质资源任意下载
 C知道
免费提问 ( 生成式Al产品 )
C知道
免费提问 ( 生成式Al产品 )
0
0
相关推荐

专栏简介
“数据挖掘与商业智能”专栏深入探讨了数据挖掘在商业智能中的应用,涵盖了各种主题。从数据挖掘技术的对比分析到深度学习的应用,专栏提供了对该领域的全面理解。它还探讨了数据挖掘在市场分析、销售预测、客户细分和异常检测中的具体应用。此外,专栏还强调了数据可视化、数据仓库设计和数据挖掘伦理的重要性。通过提供实践案例和可操作的见解,该专栏旨在帮助企业充分利用数据挖掘的力量,以提高决策制定、优化运营和获得竞争优势。
专栏目录
最低0.47元/天 解锁专栏
买1年送3月
百万级
高质量VIP文章无限畅学
千万级
优质资源任意下载
C知道
免费提问 ( 生成式Al产品 )
最新推荐
【从图纸到代码的革命】:探索CAD_CAM软件在花键加工中的突破性应用

# 摘要
随着制造业的快速发展,CAD/CAM软件的应用逐渐兴起,成为提高设计与制造效率的关键技术。本文探讨了CAD/CAM软件的基本理论、工作原理和关键技术,并分析了其在花键加工领域的具体应用。通过对CAD/CAM软件工作流程的解析和在花键加工中设计与编程的案例分析,展现了其在提高加工精度和生产效率方面的创新应用。同时,文章展望了CAD/CAM软件未来的发展趋势,重
【组态王系统优化指南】:提升性能与稳定性的10大策略

# 摘要
本文旨在对组态王系统的优化进行全面探讨,覆盖性能调优、系统稳定性和实践操作指南。首先概述组态王系统的优化重要性,然后系统性能调优理论进行了详细阐述,包括性能评估、系统资源管理、网络通信效率提升等关键要素。接着,文中提出了一系列提升系统稳定性的策略,如系统故障诊断、软件更新管理、硬件冗余与故障切换。为了将理论应用于实践,本文还提供了使用性能监控工具和系统调优的实际操作步骤。最后,通过案例分析,本文展望了组态王系统未来的发展趋势,包括人工智能、云计算等
深入揭秘:S7-200 Smart与KEPWARE数据交换的高效策略

# 摘要
本文旨在探讨基于S7-200 Smart PLC和KEPWARE软件平台的数据交换理论与实践应用。首先介绍了S7-200 Smart PLC和KEPWARE的基础知识,接着阐述了数据交换的重要性和理论基础,包括数据交换协议和通信标准,以及数据同步的原理和策略。第四章详细描述了S7-200 Smart与KEPWARE数据交换的配置步骤和实现过程,并通过案例
三菱MR-JE-A伺服电机校准指南:精准定位的秘技
# 摘要
本文全面概述了三菱MR-JE-A伺服电机的校准流程,详细介绍了伺服电机的基本工作原理,包括其控制原理和反馈系统。文中强调了校准前的准备工作,包括所需工具、设备以及安全操作环境,并给出了校准步骤的理论框架。此外,文章还详细介绍了实际操作流程,包括机械装置和电气参数的校准方法,以及校准后的验证测试。针对故障诊断和校准中的挑战,本文提供了常见问题处理方法、
【性能优化指南】:WPS与Office在文档转换为PDF的性能比较

# 摘要
本文综合探讨了WPS与Office文档转换为PDF的过程、性能比较及优化策略。首先概述了文档转换的基本原理,包括技术标准、流程分析以及转换效果的评估标准。接着,详细比较了WPS与Office在文档转换性能方面的表现,包括转换速度、质量和资源占用情况。文章还讨论了文档转换为PDF的性能优化策略,涵盖了优化理论、实践技巧以及性能监控和调优工具的使用。最后,通
Cyclone技术详解:深入核心概念,成为专家
# 摘要
Cyclone技术作为本篇论文的研究主体,是一个专注于处理数据流和并发任务的编程模型。本文第一章概述了Cyclone技术的背景和重要性。第二章深入探讨了Cyclone的核心组件和工作原理,涵盖了其架构设计原则、工作机制以及并发模型,特别强调了数据流处理和事件驱动架构对性能优化的重要性。第三章着重介绍了Cyclone的编程模型,包括语言特性、模块
版本控制系统大对决:CVS、SVN与Git优劣对比

# 摘要
本文探讨了版本控制系统在软件开发中的重要性,对比了CVS、SVN和Git这三种主流系统的原理与实践。通过对各自特点、架构、操作管理、集成扩展等方面的分析,揭示了它们在现代软件开发中的应用和局限性。文章还为选择合适的版本控制系统提供了一个评估指南,并分享了不同行业的最佳实践案例。最后,文章讨论了版本控制在持续集成和自动化测试中的作用,强调了其对提升开发效率和协作
【CAN2.0通信协议深入解析】:掌握工业控制系统与汽车电子的核心技术
# 摘要
本论文系统地介绍了CAN2.0通信协议的基础知识、工作原理、技术细节以及在工业控制系统和汽车电子领域的广泛应用。在基础章节中,详细阐述了CAN协议的架构、消息帧格式、仲裁机制及错误检测和处理策略。随后,分析了CAN2.0在工业控制网络和汽车电子通信网络中的具体应用,包括实时性能、系统集成、诊断测试以及ADAS技术整合。最后,展望了新一代CAN技术标准的进展,包括CAN FD、CAN X
【9大翻译技巧揭秘】:将GMW14241技术文档翻译提升至艺术境界

# 摘要
技术文档翻译是跨文化交流与技术传播的重要环节。本文综合分析了技术文档翻译的艺术与科学,涵盖了翻译前的详尽准备、翻译过程中的技巧实践以及翻译后的审校与优化。本文详细探讨了如何通过分析文档特点、准备翻译工具和资源以及规划翻译流程来提高翻译效率和质量。在翻译实践部分,重点介绍了如何处理技术术语、句子结构调整和文化差异,以及如何进行翻译审校与风格优化。最后,本文结合翻译案例分析,深入剖析了技术文档翻译中
【Flac3D与实际工程应用】:5个案例深度分析与操作实践指南

# 摘要
Flac3D作为一种专业岩土与矿业工程模拟软件,在工程实践中扮演着重要角色。本文首先介绍了Flac3D的基本界面和功能,随后阐述了其材料模型、本构关系、网格划分以及边界条件设置。接着,文章详细探讨了Flac3D在岩土工程中土石坝稳定性、隧道开挖及地质灾害预测的应用,以及在矿业工程中矿体开采、地压管理和采场稳定性评估的应用。
资源上传下载、课程学习等过程中有任何疑问或建议,欢迎提出宝贵意见哦~我们会及时处理!
点击此处反馈


专栏目录
最低0.47元/天 解锁专栏
买1年送3月
百万级
高质量VIP文章无限畅学
千万级
优质资源任意下载
C知道
免费提问 ( 生成式Al产品 )