MATLAB Legend and Publication Booster: Enhancing Presentation Impact with Legends in Reports and Demonstrations
发布时间: 2024-09-15 05:15:35 阅读量: 22 订阅数: 29 
# MATLAB Legends and Publishing Tools: Enhancing Presentations and Reports with Legends
## 1. Overview of MATLAB Legends
Legends in MATLAB serve as visual elements to identify different lines, markers, or areas within a graph. They provide information about the sources of data and the meanings of graphical elements to the reader.
Legends are typically located in the top right corner of the graph, containing a box with color or pattern samples for each line, marker, or area, along with corresponding labels. These labels usually represent the names of the data sources or descriptions of the graphical elements.
Legends are crucial for understanding and interpreting graphs, as they allow readers to quickly identify and differentiate between datasets. They also help organize and present information clearly, enabling readers to easily correlate data with corresponding labels.
## 2. Customizing and Beautifying Legends
Legends in MATLAB are graphical elements that explain the colors, line styles, and marker patterns of different lines, markers, or patches in a graph. By default, legends are positioned in the top right corner of the graph, but they can be customized by adjusting their location and size. Additionally, the title, labels, line styles, and colors of legends can be customized to enhance their readability and aesthetics.
### 2.1 Adjusting the Position and Size of Legends
The position of legends can be adjusted using the `legend('Location', 'location')` function, where `location` can be one of the following values:
- `'North'`: Places the legend at the top of the graph
- `'South'`: Places the legend at the bottom of the graph
- `'East'`: Places the legend on the right side of the graph
- `'West'`: Places the legend on the left side of the graph
- `'NorthEast'`: Places the legend at the top right corner (default location)
- `'NorthWest'`: Places the legend at the top left corner
- `'SouthEast'`: Places the legend at the bottom right corner
- `'SouthWest'`: Places the legend at the bottom left corner
The size of legends can be adjusted using the `legend('Position', [left, bottom, width, height])` function, where `left` and `bottom` specify the coordinates of the lower-left corner of the legend, and `width` and `height` specify the width and height of the legend.
```
% Create a graph
figure;
plot(1:10, rand(1, 10), 'b-', 1:10, rand(1, 10), 'r--', 1:10, rand(1, 10), 'g:');
% Adjust the position and size of the legend
legend('Location', 'NorthWest', 'Position', [0.1, 0.8, 0.2, 0.1]);
```
### 2.2 Setting the Title and Labels of Legends
The title of a legend can be set using the `legend(`
# 3. Applying Legends in Reports
### 3.1 Layout and Typography of Legends
In reports, the layout and typography of legends are critical as they directly affect the readability and aesthetics of the report. Here are some tips for the layout and typography of legends:
- **Vertical or Horizontal Arrangement:** Legends can be arranged vertically or horizontally depending on the overall layout of the report and spatial constraints. Vertical arrangements are typically used for longer legends, while horizontal arrangements are suitable for shorter ones.
- **Location of Legends:** Legends are usually placed below or to the right of charts to avoid obscuring the data within the charts.
- **Size of Legends:** The size of legends should match the size of the charts. Legends that are too large can be distracting, while those that are too small can be difficult to read.
- **Spacing Between Legend Elements:** There should be appropriate spacing between elements in the legend to enhance readability.
### 3.2 Annotations and Explanations in Legends
Annotations and explanations in legends can provide additional information, helping readers understand the elements within the legends. Here are some methods for adding annotations and explanations:
- **Adding Text Labels:** Text labels can be

 百万级
高质量VIP文章无限畅学
百万级
高质量VIP文章无限畅学
 千万级
优质资源任意下载
千万级
优质资源任意下载
 C知道
免费提问 ( 生成式Al产品 )
C知道
免费提问 ( 生成式Al产品 )
0
0
相关推荐

专栏目录
最低0.47元/天 解锁专栏
买1年送3月
百万级
高质量VIP文章无限畅学
千万级
优质资源任意下载
C知道
免费提问 ( 生成式Al产品 )
最新推荐
【揭秘半导体掺杂】:快速掌握芯片制造的核心技术

# 摘要
本文首先概述了半导体材料及其掺杂的基本概念,随后深入探讨了掺杂的理论基础和不同掺杂类型,包括N型与P型掺杂的原理、杂质选择以及复合掺杂技术。接着,文章详细介绍了掺杂技术在实验与实践中的设备、材料选择和工艺流程,以及掺杂效果的检测方法。在第四章中,重点讨论了掺杂技术在芯片制造中的应用,包括不同工艺节点的挑战和掺杂技术的最新发展趋势。最后,文章分析了当前掺杂技术
【MagicDraw终极指南】:掌握基础到高级操作的15个关键步骤
# 摘要
本文系统地介绍了MagicDraw的使用方法及其在建模过程中的应用。首先概述了MagicDraw的基本概念、安装流程和基础知识,包括UML图的种类和用途、界面布局以及基础图形的绘制。随后,文章深入探讨了UML图的不同类型,如类图、时序图、活动图、使用案例图和组件图,详细阐述了它们的结构、关系以及编辑方法。在高级技巧章节,本文分享了模型转换、代码生成、团队协作和扩展工具等专业技能。最后,通过实践案例分析,展示了如何从概念设计
如何提高线性VF转换器的转换精度与稳定性:专家级调试技巧大公开
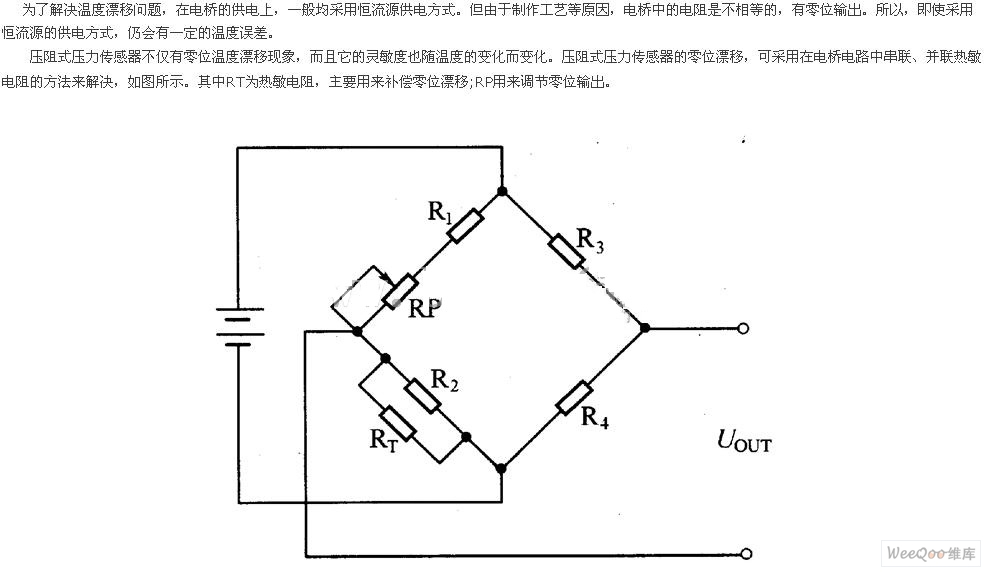
# 摘要
线性电压-频率(VF)转换器是将电压信号转换为频率信号的电子设备,在许多工业和测量应用中扮演着关键角色。本文首先概述了线性VF转换器的基本概念和工作原理,然后重点讨论了提高其转换精度和稳定性的理论基础和实践技巧。通过分析影响精度和稳定性的各种因素,本文揭示了信号处理技术与控制策略在提升VF转换器性能方面的重要性。专家级调试技巧部分深入探讨了精度和稳定性调试的方法和工具。案例分析章节提供了在实际应
STM32 HAL库初探:快速入门与基础配置指南

# 摘要
本文深入探讨了STM32微控制器及其硬件抽象层(HAL)库的使用和编程实践。首先概述了STM32及其HAL库的基础知识,然后详细介绍了HAL库的安装、项目设置、中断管理、定时器应用、串口通信,以及如何利用高级特性如DMA、实时时钟RTC和外设电源控制来优化开发。文章以智能温室控制系统为例,阐述了如何创建基于HAL库的项目模板,实现核心功能,并进行调试、测试与部署,以达到快速且高效的开发流程。
【TorchCUDA错误案例分析】:揭示AssertionError的幕后真相及修复之道

# 摘要
本文针对在使用PyTorch时遇到的TorchCUDA错误进行了深入分析。首先回顾了CUDA的基础知识,并探讨了PyTorch如何与CUDA集成。接着,文章分析了AssertionError的常见原因,包括设备不匹配和核函数执行错误。通过详细诊断与分析章节,提供了日志解读和调试工具使用
AI在医疗领域的革新:揭秘技术推动下的行业变革,5大突破案例

# 摘要
本文全面探讨了人工智能(AI)在医疗领域的革新及其应用,涵盖诊断、治疗、服务和资源优化等关键领域。文章首先概述了AI在医疗行业的重要性,然后详细介绍了AI在医学影像分析、病理诊断和早期疾病预测中的具体应用。进一步地,本文探讨了AI在个性化药
【智能卡交易性能提升指南】:ISO7816-4优化技巧与最佳实践
# 摘要
本文对ISO7816-4标准进行了全面概述,并分析了智能卡交易的基础理论。在性能优化方面,探讨了智能卡交易性能的影响因素,包括通信延迟、带宽限制、多任务处理、资源调度和加密算法的效率,并提出了基于硬件加速技术和软件优化策略的实用解决方案。同时,本文还深入研究了智能卡交易的安全性问题,包括安全性能理论分析、安全威胁与对策、安全优化策略,以及安全加固的实施案例。最后,本文提出了在性能与安全之间平衡的最佳实践,并对未来智能卡交易性能优化的发展趋势进行了展望,强调了持续改进框架与建议的重要性。
# 关键字
ISO7816-4标准;智能卡交易;性能优化;安全加固;硬件加速;软件优化策略
参
FBX转换器终极指南:从入门到精通的10大必备技巧

# 摘要
本文全面介绍了FBX转换器的基础知识、三维模型转换原理、实用技巧、高级功能以及拓展应用。首先,概述了FBX格式的核心优势及其在三维动画和其他应用领域的应用。接着,分析了三维模型数据转换的理论基础,包括顶点、面、材质和动画数据转换的关键点以及坐标系统的处理。然后,探讨了转换器在不同软件间的协同工作,并提供了优化转换设置的实用技巧、常见问题的诊断与解决方案,以及成功案例与经验
【降落伞选购的期望价值计算】:概率模型助你明智决策
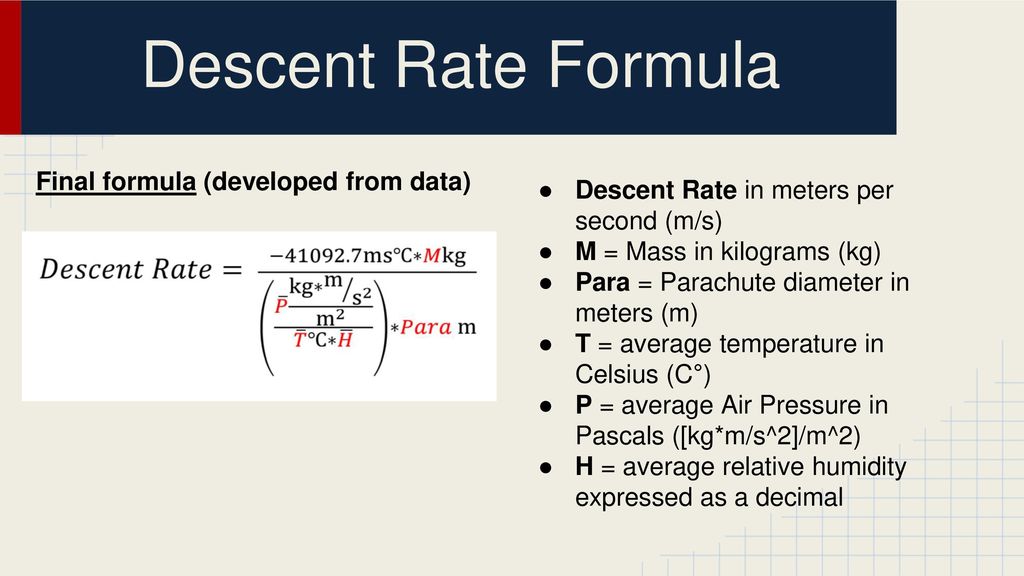
# 摘要
本文探讨了降落伞选购中期望价值理论的应用,强调概率模型的构建及其在降落伞性能与安全性评估中的重要性。文章首先介绍了概率论基础及其模型类型,然后深入分析了期望价值理论框架及其在决策中的作用。通过实证分析与案例研究,本文展示了如何计算降落伞选购中的期望价值,并提出了风险管理策略。此外,文章展望了新技术在降落伞设计中的应用
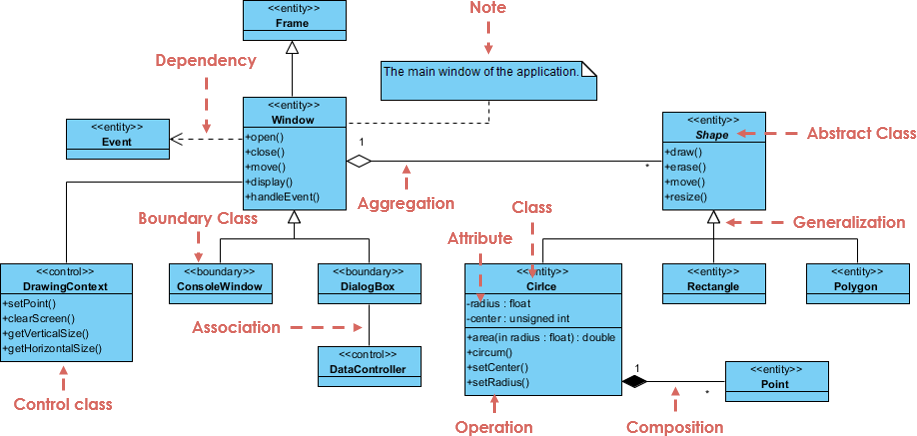
【UML类图全解析】:深入医院管理系统,掌握实体关系的秘密武器
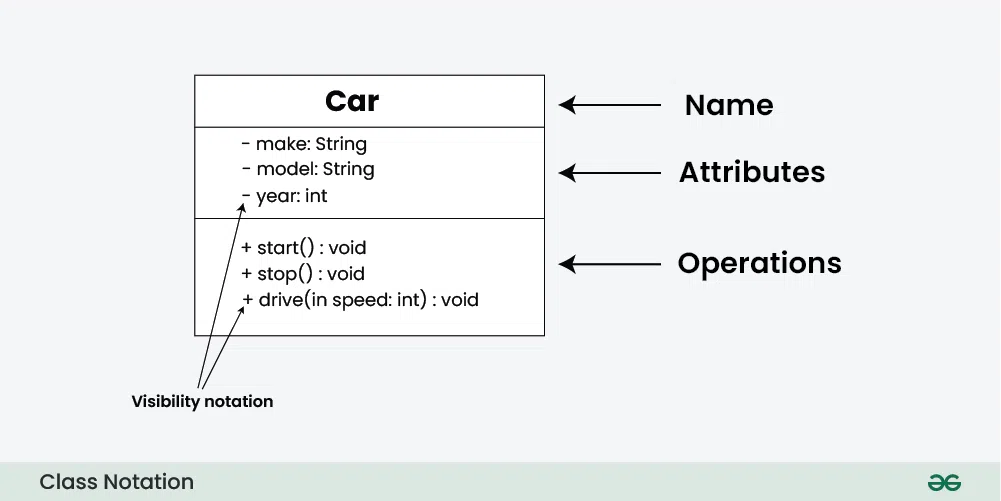
# 摘要
UML(统一建模语言)类图是软件工程中重要的设计工具,它有助于开发人员在软件构建阶段明确系统结构和类之间的关系。本文首先介绍了UML类图的基础概念和核心元素,包括类与对象的定义、关联关系、依赖与继承等。接着探讨了类图的高级特性,如接口、抽象类和泛型的应用。此外,文章通过医院管理系统案例,展示了类图在实际系统需求分析、设计实体类和关系,以及系统开发迭代中的应用。最后,本文总结了实践技巧,包括类图
资源上传下载、课程学习等过程中有任何疑问或建议,欢迎提出宝贵意见哦~我们会及时处理!
点击此处反馈


专栏目录
最低0.47元/天 解锁专栏
买1年送3月
百万级
高质量VIP文章无限畅学
千万级
优质资源任意下载
C知道
免费提问 ( 生成式Al产品 )