Getting to Know OSGEarth: Basic Concepts and Applications of an Open Source Geographic Information System
发布时间: 2024-09-14 14:14:01 阅读量: 70 订阅数: 35 

Image Steganography: Basic Concepts and Proposed Algorithm
# Introduction to OSGEarth
## 1.1 What is OSGEarth?
OSGEarth is an open-source Geographic Information System (GIS) framework designed to offer a flexible and high-performance tool for three-dimensional geospatial data visualization and analysis. It is built on top of the open-source Geographic Information System OpenSceneGraph (OSG), and it has a wide range of applications in the field of geographic information visualization.
## 1.2 History and Development of OSGEarth
Initially developed by the Air Force Research Laboratory (AFRL) in the United States to support the visualization and interactive analysis of spatial data, OSGEarth has gradually evolved into a feature-rich, community-active open-source project with widespread attention in the field of geographic information.
## 1.3 Differences between OSGEarth and Other Geographic Information Systems
Compared to traditional geographic information systems, OSGEarth focuses on presenting geospatial data in a three-dimensional environment, providing more intuitive and vivid map display effects. With its powerful rendering engine based on OSG, OSGEarth supports high-performance geographic data visualization and is widely used in aerospace, national defense security, urban planning, and other fields.
# Basic Concepts of OSGEarth
Before exploring OSGEarth, it's essential to understand the basic concepts of Geographic Information Systems (GIS) and to introduce the core functions of OSGEarth and the data formats it supports.
### 2.1 Introduction to Geographic Information Systems (GIS)
A Geographic Information System (GIS) is a computer system that integrates geographic data, data processing tools, and map display functionality, capable of storing, managing, analyzing, and displaying geographic information. GIS is widely used in various fields, including urban planning, resource management, and environmental protection.
### 2.2 Introduction to OSGEarth's Core Functions
OSGEarth is an open-source Geographic Information System framework with core functions including the display, visualization, analysis, and editing of map data. With OSGEarth, users can create high-performance Geographic Information System applications and achieve complex geospatial data visualization effects.
### 2.3 Data Formats Supported by OSGEarth
OSGEarth supports a variety of data formats, including common raster data, vector data, and elevation data. When using OSGEarth, users can import map data through these data formats for display and analysis. This data format support gives OSGEarth a broader range of applications and can meet geospatial information needs in different scenarios.
# Installation and Configuration of OSGEarth
In this chapter, we will provide detailed instructions on how to install and configure OSGEarth to start using this powerful open-source Geographic Information System.
#### 3.1 Steps for Installing OSGEarth
First, let's look at how to install OSGEarth on your system. Here are some simple steps:
1. **Download the OSGEarth package**: You can download the latest version of the package from the official OSGEarth website.
2. **Unzip the package**: Unzip the downloaded package to the directory of your choice.
3. **Run the installer**: Follow the installation guide in the package to run the installer.
4. **Check the installation**: After installation, you can check if it's successfully installed by typing `osgearth -v` in the command line.
#### 3.2 Configuring the OSGEarth Environment
Once OSGEarth is installed, the next step is to configure the environment to ensure the system runs properly. Here are some common configuration steps:
- **Set environment variables**: Make sure to add the OSGEarth executable path to the system's environment variables.
- **Configure data paths**: Specify the storage paths for map data in the OSGEarth configuration file.
- **Adjust performance parameters**: Depending on your system configuration and needs, you can adjust OSGEarth's performance parameters.
#### 3.3 Adding Map Data to OSGEarth
Adding map data is one of the key steps in using OSGEarth. You can follow these steps to import map data into OSGEarth:
1. **Prepare map data**: Make sure you have the map data files you need to import, such as Shapefile, KML, etc.
2. **Configure layers**: Define new layers in the OSGEarth configuration file and specify the data file paths.
3. **Load map data**: Start OSGEarth and load the configured layers; you'll see the map data displayed in OSGEarth.
By following these simple steps, you can successfully install, configure, and add map data to OSGEarth, preparing for subsequent Geographic Information System applications.
# Basic Functions and Applications of OSGEarth
In this chapter, we will delve into the basic functions and common applications of OSGEarth to help readers better understand how to use OSGEarth for map data display, spatial data visualization, and the application of map data analysis and editing tools.
#### 4.1 Display and Browsing of Map Data
OSGEarth offers robust map data display and browsing capabilities. Users can load various map data sources and perform zoom, pan, rotate, and other operations on the map through the control panel. The following is a simple Python example code demonstrating how to display and browse map data in OSGEarth:
```python
from osgearth import *
from osgearth import osgearth as oe
# Create an earth model
earth = oe.MapNode()
mapNode = oe.MapNode();
# Load online map data source
base = oe.ImageLayerOptions()
base.name = "TMS Imagery"
base.url = "***"
imageryLayer = oe.ImageLayer(base)
# Add map data to the earth model
mapNode.getLayers().push_back( imageryLayer )
earth.addChild( mapNode )
# Create a Viewer
viewer = oe.Viewer()
# Set initial view
viewer.setCameraManipulator(oeUtil.EarthManipulator())
# Run the view
viewer.setScene(earth)
viewer.run()
```
With the above code, we can load online map data sources and display map data in OSGEarth. Users can browse the map through the control panel operations.
#### 4.2 Introduction to Spatial Data Visualization Functions
In addition to basic map data display functions, OSGEarth also provides rich spatial data visualization functions. Users can implement spatial data visualization by adding various vector layers, point cloud data, etc. The following is a Java example code demonstrating how to achieve spatial data visualization in OSGEarth:
```java
// Create an earth model
MapNode earth = new MapNode();
// Load vector layer data
FeatureSource featureSource = new FeatureSource("path/to/shapefile.shp");
FeatureModelLayer featureLayer = new FeatureModelLayer(featureSource);
earth.getLayers().add(featureLayer);
// Add point cloud data
PointCloudLayer pointCloudLayer = new PointCloudLayer("path/to/pointcloud.las");
earth.getLayers().add(pointCloudLayer);
// Create a Viewer
Viewer viewer = new Viewer();
// Set initial view
viewer.setCameraManipulator(new EarthManipulator());
// Run the view
viewer.setScene(earth);
viewer.run();
```
With the above Java code, we can load vector layer data and point cloud data and implement spatial data visualization, making it convenient for users to analyze and display data.
#### 4.3 Map Data Analysis and Editing Tools
OSGEarth also offers a rich set of map data analysis and editing tools. Users can analyze, edit, and process map data through these tools. The following is a Go example code demonstrating how to perform map data analysis in OSGEarth:
```go
package main
import (
"***/golang/geo/s2"
)
func main() {
// Create a square area
region := s2.RectFromLatLng(s2.LatLngFromDegrees(30, 10),
s2.LatLngFromDegrees(40, 20))
// Get the center point coordinates of the area
center := region.Center()
fmt.Println("Region Center Latitude:", center.Lat, "Longitude:", center.Lng)
}
```
With the above Go code, we can create a square area and obtain the center point coordinates, which is a simple example of map data analysis.
In this chapter, we introduced the basic functions and common applications of OSGEarth, hoping to help readers better use OSGEarth for map data display and processing.
# Exploring Advanced Features of OSGEarth
In this chapter, we will delve into the advanced features of OSGEarth, including an in-depth understanding of three-dimensional map display capabilities, map layer management, and integration methods with other software.
#### 5.1 In-depth Understanding of Three-dimensional Map Display Capabilities
In OSGEarth, three-dimensional map display is one of its most prominent features. By combining high-definition satellite imagery, terrain data, and building models, OSGEarth can present realistic three-dimensional map scenes. Developers can achieve three-dimensional map display through simple code calls, as shown below:
```java
// Create a three-dimensional window
Viewpoint viewpoint = new Viewpoint();
viewpoint.setLatitude(37.7749);
viewpoint.setLongitude(-122.4194);
viewpoint.setAltitude(1000.0);
// Set the window parameters
viewpoint.setHeading(45.0);
viewpoint.setPitch(-15.0);
// Apply the window to the map
map.setInitialViewpoint(viewpoint);
```
In the above code, we create a three-dimensional window, set the latitude and longitude, viewing altitude, rotation angle, and pitch angle of the window, and apply the window to the map, thus achieving a simple three-dimensional map display function. By adjusting the window parameters, developers can achieve three-dimensional map display effects from different angles and heights.
#### 5.2 Map Layer Management in OSGEarth
OSGEarth supports various map data sources, and developers can flexibly manage map layers to achieve the overlay and switching of different layers. The following is a simple example of map layer management code:
```python
# Add a tile layer
layer = Layer()
layer.setName("Google Maps")
layer.setType(LayerType.TMS)
layer.setURL("***${x}&y=${y}&z=${z}")
# Add the layer to the map
map.addLayer(layer)
```
In the above code, we create a tile layer named "Google Maps" and add the layer to the map. By setting the layer's URL and type, it's easy to add different types of map layers, achieving diverse map data display.
#### 5.3 Methods for Integrating OSGEarth with Other Software
As an open-source Geographic Information System, OSGEarth supports integration with other software, enabling more abundant functions and applications. For example, integration with Cesium.js can achieve more powerful three-dimensional map display capabilities; integration with QGIS can achieve map data editing and analysis functions. The following is an integration example code:
```javascript
// Integration with Cesium.js
var cesiumViewer = new Cesium.Viewer('cesiumContainer');
earth.addCesiumIntegration(cesiumViewer);
// Integration with QGIS
var qgisLayer = new QGISLayer("***");
map.addLayer(qgisLayer);
```
With the above integration examples, it can be seen that OSGEarth can seamlessly integrate with other GIS software, further expanding its functionality and application scope.
In this chapter, we have explored the advanced features of OSGEarth, including three-dimensional map display, map layer management, and integration methods with other software. By learning and practicing these advanced features, developers can apply OSGEarth more flexibly and diversely for geographic information processing and display.
# Future Prospects and Development Direction of OSGEarth
In the field of Geographic Information Systems, OSGEarth, as an open-source Geographic Information System platform, has significant development potential and space. The following are possible future development directions and prospects for OSGEarth:
#### 6.1 Development Trends of OSGEarth in the Geographic Information Field
With continuous technological progress and innovation, Geographic Information Systems are being increasingly widely used in various fields. As an open-source GIS platform, OSGEarth may achieve further development in the following aspects:
- Support more geographic data formats, providing more data display and analysis functions;
- Strengthen integration with other GIS systems and map service platforms, achieving application scenarios in more fields;
- Improve performance and stability, supporting the processing and display of large-scale data;
- Develop three-dimensional map technology, providing a more immersive map display experience.
#### 6.2 Possible Future Functional Expansion and Improvement Directions
To adapt to changing market demands and technological trends, OSGEarth may expand and improve its functions in the following aspects in the future:
- Enhance spatial data visualization and analysis capabilities, providing more map data processing and presentation abilities;
- Improve the user interface and interaction experience, providing a more friendly and intuitive operation interface;
- Strengthen map data editing and sharing capabilities, facilitating data processing and dissemination for users;
- Provide more customization and extensibility features to meet the personalized needs of different users.
#### 6.3 Contributions and Support from the Open Source Community to OSGEarth
As an open-source Geographic Information System platform, OSGEarth has received active support and contributions from the global open-source community. In the future, the open-source community may continue to contribute and support OSGEarth in the following aspects:
- Provide more plugins and extension tools, enriching the functions and application scenarios of OSGEarth;
- Continuously optimize and improve code quality, enhancing system stability and performance;
- Carry out training and educational activities to promote the application and dissemination of OSGEarth in the field of geographic information;
- Engage in international cooperation and project exchanges to promote the global promotion and application of OSGEarth.
In summary, as a powerful and highly flexible open-source Geographic Information System platform, OSGEarth will continue to grow and develop in the future, providing users with better geographic information processing and display services. We hope that OSGEarth can gain more widespread recognition and application in the open-source community and the field of geographic information.

 百万级
高质量VIP文章无限畅学
百万级
高质量VIP文章无限畅学
 千万级
优质资源任意下载
千万级
优质资源任意下载
 C知道
免费提问 ( 生成式Al产品 )
C知道
免费提问 ( 生成式Al产品 )
0
0
相关推荐

专栏目录
最低0.47元/天 解锁专栏
买1年送3月
百万级
高质量VIP文章无限畅学
千万级
优质资源任意下载
C知道
免费提问 ( 生成式Al产品 )
最新推荐
【软件管理系统设计全攻略】:从入门到架构的终极指南
# 摘要
随着信息技术的飞速发展,软件管理系统成为支持企业运营和业务创新的关键工具。本文从概念解析开始,系统性地阐述了软件管理系统的需求分析、设计、数据设计、开发与测试、部署与维护,以及未来的发展趋势。重点介绍了系统需求分析的方法论、系统设计的原则与架构选择、数据设计的基础与高级技术、以及质量保证与性能优化。文章最后
【硬盘修复的艺术】:西数硬盘检测修复工具的权威指南(全面解析WD-L_WD-ROYL板支持特性)
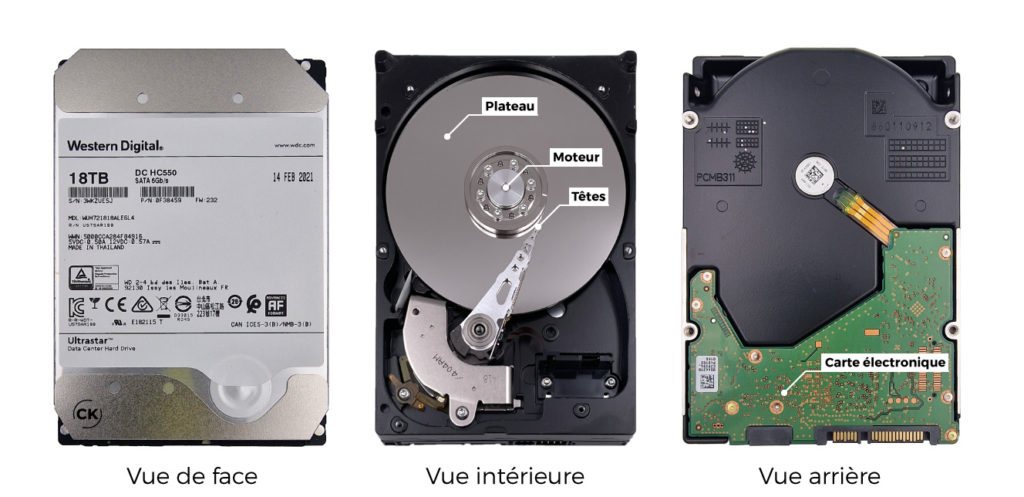
# 摘要
本文深入探讨了硬盘修复的基础知识,并专注于西部数据(西数)硬盘的检测修复工具。首先介绍了西数硬盘的内部结构与工作原理,随后阐述了硬盘故障的类型及其原因,包括硬件与软件方面的故障。接着,本文详细说明了西数硬盘检测修复工具的检测和修复理论基础,以及如何实践安装、配置和
【sCMOS相机驱动电路信号完整性秘籍】:数据准确性与稳定性并重的分析技巧

# 摘要
本文针对sCMOS相机驱动电路信号完整性进行了系统的研究。首先介绍了信号完整性理论基础和关键参数,紧接着探讨了信号传输理论,包括传输线理论基础和高频信号传输问题,以及信号反射、串扰和衰减的理论分析。本文还着重分析了电路板布局对信号完整性的影响,提出布局优化策略以及高速数字电路的布局技巧。在实践应用部分,本文提供了信号完整性测试工具的选择,仿真软件的应用,
能源转换效率提升指南:DEH调节系统优化关键步骤
# 摘要
能源转换效率对于现代电力系统至关重要,而数字电液(DEH)调节系统作为提高能源转换效率的关键技术,得到了广泛关注和研究。本文首先概述了DEH系统的重要性及其基本构成,然后深入探讨了其理论基础,包括能量转换原理和主要组件功能。在实践方法章节,本文着重分析了DEH系统的性能评估、参数优化调整,以及维护与故障排除策略。此外,本文还介绍了DEH调节系统的高级优化技术,如先进控制策略应用、系统集成与自适应技术,并讨论了节能减排的实现方法。最后,本文展望了DEH系统优化的未来趋势,包括技术创新、与可再生能源的融合以及行业标准化与规范化发展。通过对DEH系统的全面分析和优化技术的研究,本文旨在为提
【AT32F435_AT32F437时钟系统管理】:精确控制与省电模式

# 摘要
本文系统性地探讨了AT32F435/AT32F437微控制器中的时钟系统,包括其基本架构、配置选项、启动与同步机制,以及省电模式与能效管理。通过对时钟系统的深入分析,本文强调了在不同应用场景中实现精确时钟控制与测量的重要性,并探讨了高级时钟管理功能。同时,针对时钟系统的故障预防、安全机制和与外围设备的协同工作进行了讨论。最后,文章展望了时
【MATLAB自动化脚本提升】:如何利用数组方向性优化任务效率
# 摘要
本文深入探讨MATLAB自动化脚本的构建与优化技术,阐述了MATLAB数组操作的基本概念、方向性应用以及提高脚本效率的实践案例。文章首先介绍了MATLAB自动化脚本的基础知识及其优势,然后详细讨论了数组操作的核心概念,包括数组的创建、维度理解、索引和方向性,以及方向性在数据处理中的重要性。在实际应用部分,文章通过案例分析展示了数组方向性如何提升脚本效率,并分享了自动化
现代加密算法安全挑战应对指南:侧信道攻击防御策略
# 摘要
侧信道攻击利用信息泄露的非预期通道获取敏感数据,对信息安全构成了重大威胁。本文全面介绍了侧信道攻击的理论基础、分类、原理以及实际案例,同时探讨了防御措施、检测技术以及安全策略的部署。文章进一步分析了侧信道攻击的检测与响应,并通过案例研究深入分析了硬件和软件攻击手段。最后,本文展望了未来防御技术的发展趋势,包括新兴技术的应用、政策法规的作用以及行业最佳实践和持续教育的重要性。
# 关键字
侧信道攻击;信息安全;防御措施;安全策略;检测技术;防御发展趋势
参考资源链接:[密码编码学与网络安全基础:对称密码、分组与流密码解析](https://wenku.csdn.net/doc/64
【科大讯飞语音识别技术完全指南】:5大策略提升准确性与性能
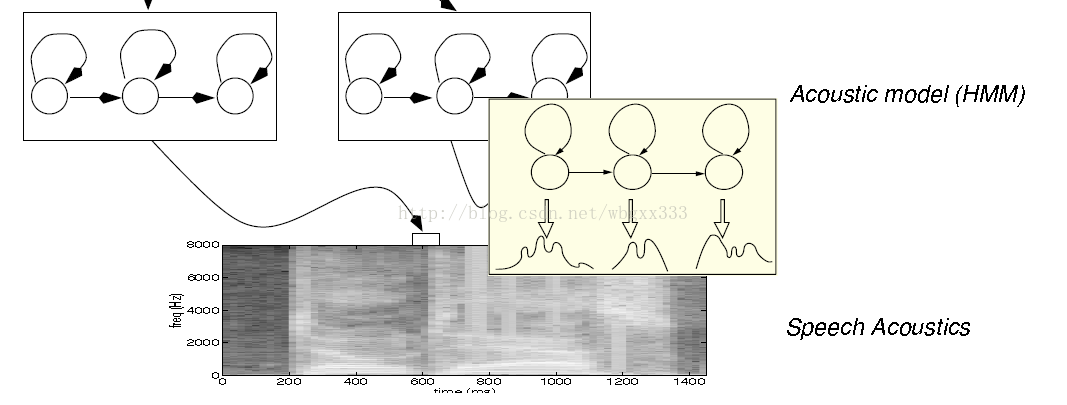
# 摘要
本论文综述了语音识别技术的基础知识和面临的挑战,并着重分析了科大讯飞在该领域的技术实践。首先介绍了语音识别技术的原理,包括语音信号处理基础、自然语言处理和机器学习的应用。随
【现场演练】:西门子SINUMERIK测量循环在多样化加工场景中的实战技巧
# 摘要
本文旨在全面介绍西门子SINUMERIK测量循环的理论基础、实际应用以及优化策略。首先概述测量循环在现代加工中心的重要作用,继而深入探讨其理论原理,包括工件测量的重要性、测量循环参数设定及其对工件尺寸的影响。文章还详细分析了测量循环在多样化加工场景中的应用,特别是在金属加工和复杂形状零件制造中的挑战,并提出相应的定制方案和数据处理方法。针对多轴机床的测量循环适配,探讨了测量策略和同步性问题。此外,本文还探讨了测量循环的优化方法、提升精确度的技巧,以及西门子SINUMERIK如何融合新兴测量技术。最后,本文通过综合案例分析与现场演练,强调了理论与实践的结合,并对未来智能化测量技术的发展
资源上传下载、课程学习等过程中有任何疑问或建议,欢迎提出宝贵意见哦~我们会及时处理!
点击此处反馈


专栏目录
最低0.47元/天 解锁专栏
买1年送3月
百万级
高质量VIP文章无限畅学
千万级
优质资源任意下载
C知道
免费提问 ( 生成式Al产品 )