【集成学习秘籍】:从理论到实战,打造高性能机器学习模型
发布时间: 2024-08-21 21:06:40 阅读量: 23 订阅数: 29 
# 1. 集成学习概述**
集成学习是一种机器学习技术,它通过结合多个基学习器来提高模型的预测性能。集成学习的基本思想是,将多个较弱的学习器组合成一个更强大的学习器,从而实现更好的泛化能力和鲁棒性。
集成学习方法主要分为三种类型:Bagging、Boosting和Stacking。Bagging通过对训练数据进行有放回的采样,生成多个基学习器,并对它们的预测结果进行平均或投票。Boosting通过对训练数据进行加权采样,重点训练表现较差的样本,并对基学习器的预测结果进行加权求和。Stacking将多个基学习器的预测结果作为输入,训练一个新的学习器进行最终预测。
# 2. 集成学习理论基础
### 2.1 集成学习方法
集成学习是一种机器学习技术,它通过结合多个基学习器来增强模型的预测性能。基学习器可以是任何类型的机器学习算法,例如决策树、神经网络或支持向量机。
集成学习方法主要分为三大类:
#### 2.1.1 Bagging
Bagging(Bootstrap Aggregating)是一种集成学习方法,它通过对训练集进行有放回的采样来生成多个基学习器。每个基学习器在不同的训练集上训练,然后将它们的预测结果进行平均或投票以得到最终的预测。
**代码块:**
```python
import numpy as np
from sklearn.ensemble import BaggingClassifier
from sklearn.tree import DecisionTreeClassifier
# 创建基学习器
base_estimator = DecisionTreeClassifier()
# 创建 Bagging 集成器
bagging_classifier = BaggingClassifier(base_estimator=base_estimator, n_estimators=100)
# 训练集成器
bagging_classifier.fit(X_train, y_train)
# 预测
y_pred = bagging_classifier.predict(X_test)
```
**逻辑分析:**
* `n_estimators`参数指定了基学习器的数量。
* `fit()`方法使用有放回的采样技术对训练集进行采样,并训练每个基学习器。
* `predict()`方法将每个基学习器的预测结果进行平均,得到最终的预测。
#### 2.1.2 Boosting
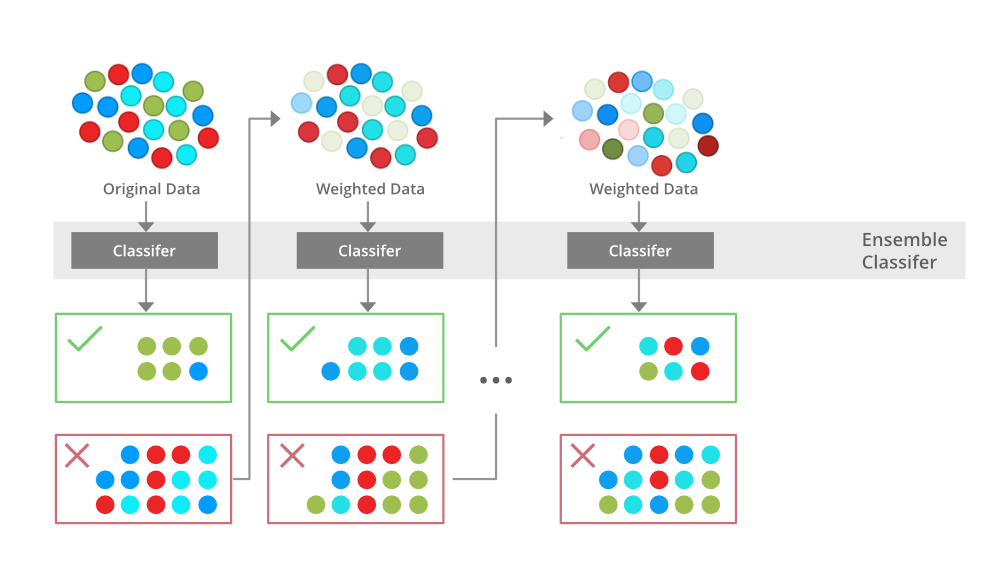
Boosting是一种集成学习方法,它通过对训练集进行加权采样来生成多个基学习器。每个基学习器在不同的权重分布下训练,并且后续的基学习器会重点关注前一个基学习器预测错误的样本。
**代码块:**
```python
import numpy as np
from sklearn.ensemble import AdaBoostClassifier
from sklearn.tree import DecisionTreeClassifier
# 创建基学习器
base_estimator = DecisionTreeClassifier()
# 创建 Boosting 集成器
boosting_classifier = AdaBoostClassifier(base_estimator=base_estimator, n_estimators=100)
# 训练集成器
boosting_classifier.fit(X_train, y_train)
# 预测
y_pred = boosting_classifier.predict(X_test)
```
**逻辑分析:**
* `n_estimators`参数指定了基学习器的数量。
* `fit()`方法使用加权采样技术对训练集进行采样,并训练每个基学习器。
* `predict()`方法将每个基学习器的预测结果进行加权平均,得到最终的预测。
#### 2.1.3 Stacking
Stacking是一种集成学习方法,它通过将多个基学习器的预测结果作为输入来训练一个元学习器。元学习器是一个独立的机器学习算法,它可以将基学习器的预测结果组合成最终的预测。
**代码块:**
```python
import numpy as np
from sklearn.ensemble import StackingClassifier
from sklearn.linear_model import LogisticRegression
from sklearn.tree import DecisionTreeClassifier
# 创建基学习器
base_estimators = [DecisionTreeClassifier(), LogisticRegression()]
# 创建元学习器
meta_estimator = LogisticRegression()
# 创建 Stacking 集成器
stacking_classifier = StackingClassifier(estimators=base_estimators, final_estimator=meta_estimator)
# 训练集成器
stacking_classifier.fit(X_train, y_train)
# 预测
y_pred = stacking_classifier.predict(X_test)
```
**逻辑分析:**
* `estimators`参数指定了基学习器的列表。
* `final_estimator`参数指定了元学习器。
* `fit()`方法训练基学习器,并使用基学习器的预测结果训练元学习器。
* `predict()`方法使用元学习器进行最终的预测。
### 2.2 集成学习效果评估
集成学习模型的效果评估与单个机器学习模型的评估类似。常用的评估指标包括:
* **准确率:**预测正确的样本数量与总样本数量之比。
* **召回率:**预测为正类的正类样本数量与实际正类样本数量之比。
* **F1 分数:**准确率和召回率的加权调和平均值。
* **ROC 曲线:**真实正例率与虚假正例率之间的关系曲线。
* **AUC:**ROC 曲线下的面积,表示模型区分正负样本的能力。
集成学习模型的评估还可以考虑以下因素:
* **基学习器多样性:**基学习器之间的差异性有助于提高集成模型的性能。
* **基学习器数量:**基学习器数量的增加通常会提高集成模型的性能,但也会增加训练时间。
* **超参数优化:**集成模型的超参数,例如基学习器的超参数和集成方法的超参数,需要进行优化以获得最佳性能。
# 3.1 数据预处理和特征工程
**3.1.1 数据清洗和转换**
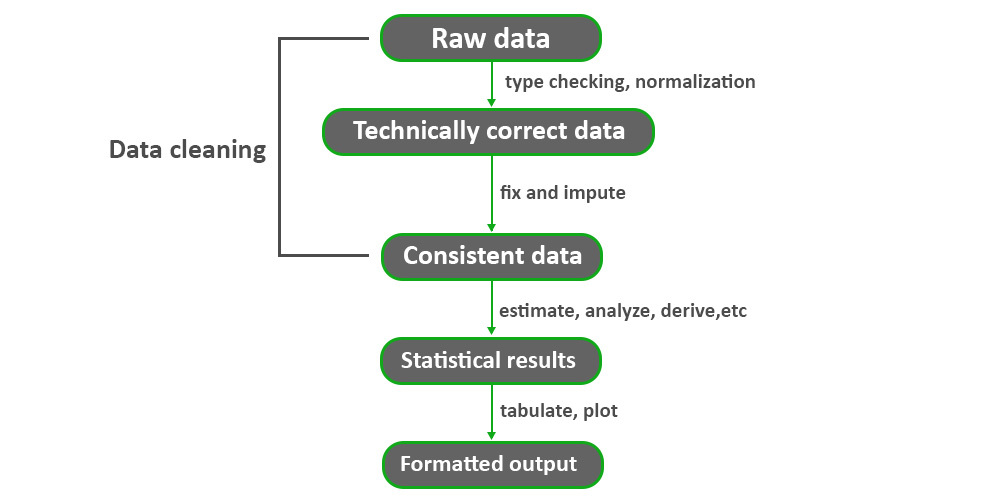
数据清洗和转换是集成学习实践应用的第一步,其目的是将原始数据转换为适合建模和分析的格式。数据清洗过程包括:
- **缺失值处理:**缺失值可能是由于数据收集或记录错误造成的。对于数值型数据,缺失值可以填充为平均值、中位数或众数;对于分类型数据,缺失值可以填充为众数或其他合适的类别。
- **异常值处理:**异常值是极端值,可能对建模结果产生不利影响。异常值可以删除、替换或截断。
- **数据类型转换:**将数据转换为适合建模算法的数据类型。例如,将文本数据转换为数字数据,将日期数据转换为时间戳。
**代码块:**
```python
import pandas as pd
# 缺失值处理
df = df.fillna(df.mean())
# 异常值处理
df = df[df['feature'] < df['feature'].quantile(0.99)]
# 数据类型转换
df['date'] = pd.to_datetime(df['date'])
```
**逻辑分析:**
- `fillna()`函数使用平均值填充缺失值。
- `quantile()`函数返回给定百分位数的阈值,用于识别异常值。
- `to_datetime()`函数将字符串日期转换为时间戳。
**3.1.2 特征选择和降维**
特征选择和降维是减少模型输入特征数量的过程,以提高模型的性能和可解释性。特征选择技术包括:
- **过滤式特征选择:**根据特征的统计信息(如方差、相关性)选择特征。
- **包裹式特征选择:**将特征选择过程与模型训练过程相结合,选择对模型性能贡献最大的特征。
- **嵌入式特征选择:**在模型训练过程中自动选择特征。
降维技术包括:
- **主成分分析 (PCA):**将数据投影到较低维度的子空间中,同时保留最大方差。
- **奇异值分解 (SVD):**将数据分解为奇异值、左奇异向量和右奇异向量的乘积。
- **线性判别分析 (LDA):**将数据投影到较低维度的子空间中,同时最大化类间方差和最小化类内方差。
**代码块:**
```python
from sklearn.feature_selection import SelectKBest, chi2
from sklearn.decomposition import PCA
# 过滤式特征选择
selector = SelectKBest(chi2, k=10)
X_selected = selector.fit_transform(X, y)
# 降维
pca = PCA(n_components=2)
X_reduced = pca.fit_transform(X)
```
**逻辑分析:**
- `SelectKBest`类使用卡方检验选择前 10 个最相关的特征。
- `PCA`类将数据投影到 2 维子空间中,保留最大方差。
# 4. 集成学习进阶应用
### 4.1 多任务学习
#### 4.1.1 多任务学习的概念和方法
多任务学习(MTL)是一种机器学习范式,它允许一个模型同时学习多个相关的任务。与传统的单任务学习不同,MTL利用任务之间的相关性来提高每个任务的性能。
MTL的原理是,不同的任务通常共享某些底层特征或知识。通过同时学习这些任务,模型可以从每个任务中学到的知识中受益,从而提高整体性能。
MTL有两种主要方法:
* **硬参数共享:**所有任务共享相同的模型参数,例如权重和偏差。这种方法简单且高效,但限制了每个任务的灵活性。
* **软参数共享:**每个任务都有自己的模型参数,但这些参数通过正则化项或其他机制进行约束,以鼓励它们共享知识。这种方法提供了更大的灵活性,但计算成本更高。
#### 4.1.2 多任务学习的应用场景
MTL广泛应用于各种领域,包括:
* **自然语言处理:**机器翻译、文本分类、命名实体识别
* **计算机视觉:**图像分类、目标检测、语义分割
* **推荐系统:**预测用户对不同商品或服务的评分
* **生物信息学:**基因表达分析、疾病诊断
### 4.2 迁移学习
#### 4.2.1 迁移学习的原理和方法
迁移学习是一种机器学习技术,它允许将在一个任务上训练的模型应用到另一个相关的任务上。与从头开始训练新模型相比,迁移学习可以节省时间和计算资源,并提高性能。
迁移学习的原理是,不同的任务通常共享某些底层特征或知识。通过将预先训练的模型应用到新任务上,模型可以利用这些共享的知识,从而更快、更有效地学习新任务。
迁移学习有两种主要方法:
* **特征提取:**预先训练的模型用于提取特征,然后这些特征用于训练新任务的分类器。
* **微调:**预先训练的模型的参数被微调,以适应新任务。这种方法通常比特征提取更有效,但计算成本也更高。
#### 4.2.2 迁移学习的应用案例
迁移学习在以下领域有广泛的应用:
* **图像分类:**使用在ImageNet数据集上预先训练的模型来分类其他图像数据集。
* **自然语言处理:**使用在大型语料库上预先训练的语言模型来执行文本分类、机器翻译等任务。
* **推荐系统:**使用在用户行为数据集上预先训练的模型来预测用户对新商品或服务的评分。
* **医学影像:**使用在医学图像数据集上预先训练的模型来诊断疾病或分割解剖结构。
# 5. 集成学习实战案例**
**5.1 图像分类任务**
**5.1.1 数据集介绍和预处理**
本案例使用 CIFAR-10 数据集,包含 60,000 张 32x32 像素的彩色图像,分为 10 个类别。
```python
import tensorflow as tf
# 加载数据集
(x_train, y_train), (x_test, y_test) = tf.keras.datasets.cifar10.load_data()
# 数据归一化
x_train, x_test = x_train / 255.0, x_test / 255.0
# 标签独热编码
y_train = tf.keras.utils.to_categorical(y_train, 10)
y_test = tf.keras.utils.to_categorical(y_test, 10)
```
**5.1.2 模型选择和训练**
使用 Bagging 集成学习方法,集成多个决策树模型。
```python
from sklearn.ensemble import BaggingClassifier
from sklearn.tree import DecisionTreeClassifier
# 创建 Bagging 集成器
bagging = BaggingClassifier(
base_estimator=DecisionTreeClassifier(),
n_estimators=100, # 集成模型数量
random_state=42
)
# 训练集成器
bagging.fit(x_train, y_train)
```
**5.1.3 性能评估和结果分析**
使用准确率和 F1 分数评估集成器的性能。
```python
from sklearn.metrics import accuracy_score, f1_score
# 预测测试集
y_pred = bagging.predict(x_test)
# 计算准确率
accuracy = accuracy_score(y_test, y_pred)
# 计算 F1 分数
f1 = f1_score(y_test, y_pred, average='macro')
print("准确率:", accuracy)
print("F1 分数:", f1)
```

 百万级
高质量VIP文章无限畅学
百万级
高质量VIP文章无限畅学
 千万级
优质资源任意下载
千万级
优质资源任意下载
 C知道
免费提问 ( 生成式Al产品 )
C知道
免费提问 ( 生成式Al产品 )
0
0
相关推荐

专栏简介
《集成学习策略与实践》专栏深入探讨了集成学习的理论、算法和应用场景。它提供了从理论到实战的全面指南,帮助读者打造高性能机器学习模型。专栏涵盖了集成学习在各个领域的广泛应用,包括计算机视觉、金融、医疗保健、推荐系统、异常检测、强化学习、边缘计算、物联网、工业 4.0、自动驾驶、网络安全和生物信息学。通过深入的分析和实际案例,该专栏旨在帮助读者掌握集成学习的奥秘,并将其应用于各种现实世界问题。
专栏目录
最低0.47元/天 解锁专栏
买1年送3个月
百万级
高质量VIP文章无限畅学
千万级
优质资源任意下载
C知道
免费提问 ( 生成式Al产品 )
最新推荐
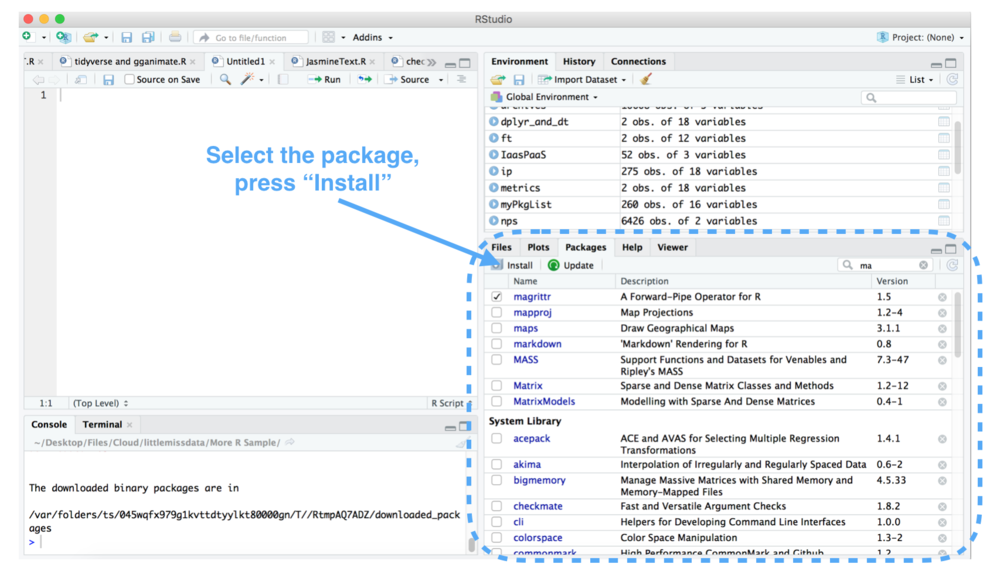
机器学习数据准备:R语言DWwR包的应用教程

# 1. 机器学习数据准备概述
在机器学习项目的生命周期中,数据准备阶段的重要性不言而喻。机器学习模型的性能在很大程度上取决于数据的质量与相关性。本章节将从数据准备的基础知识谈起,为读者揭示这一过程中的关键步骤和最佳实践。
## 1.1 数据准备的重要性
数据准备是机器学习的第一步,也是至关重要的一步。在这一阶
R语言中的概率图模型:使用BayesTree包进行图模型构建(图模型构建入门)
# 1. 概率图模型基础与R语言入门
## 1.1 R语言简介
R语言作为数据分析领域的重要工具,具备丰富的统计分析、图形表示功能。它是一种开源的、以数据操作、分析和展示为强项的编程语言,非常适合进行概率图模型的研究与应用。
```r
# 安装R语言基础包
install.packages("stats")
```
## 1.2 概率图模型简介
概率图模型(Probabi
【R语言与云计算】:利用云服务运行大规模R数据分析
# 1. R语言与云计算的基础概念
## 1.1 R语言简介
R语言是一种广泛应用于统计分析、数据挖掘和图形表示的编程语言和软件环境。其强项在于其能够进行高度自定义的分析和可视化操作,使得数据科学家和统计师可以轻松地探索和展示数据。R语言的开源特性也促使其社区持续增长,贡献了大量高质量的包(Package),从而增强了语言的实用性。
## 1.2 云计算概述
云计算是一种通过互联网提供按需
【多层关联规则挖掘】:arules包的高级主题与策略指南
# 1. 多层关联规则挖掘的理论基础
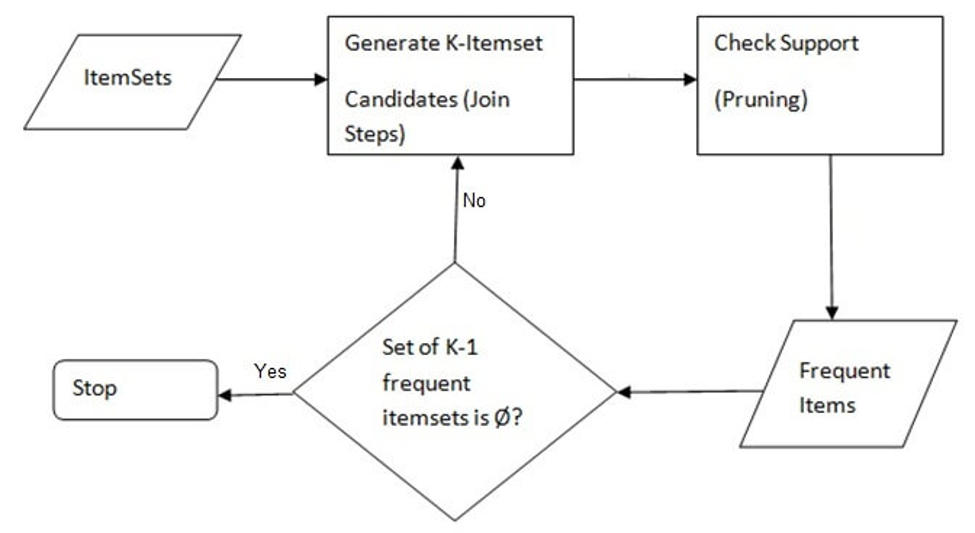
关联规则挖掘是数据挖掘领域中的一项重要技术,它用于发现大量数据项之间有趣的关系或关联性。多层关联规则挖掘,在传统的单层关联规则基础上进行了扩展,允许在不同概念层级上发现关联规则,从而提供了更多维度的信息解释。本章将首先介绍关联规则挖掘的基本概念,包括支持度、置信度、提升度等关键术语,并进一步阐述多层关联规则挖掘的理论基础和其在数据挖掘中的作用。
## 1.1 关联规则挖掘
【R语言金融数据分析】:lars包案例研究与模型构建技巧
# 1. R语言在金融数据分析中的应用概述
金融数据分析是运用统计学、计量经济学以及计算机科学等方法来分析金融市场数据,以揭示金融资产价格的变动规律和金融市场的发展趋势。在众多的数据分析工具中,R语言因其强大的数据处理能力和丰富的统计分析包,已成为金融领域研究的宠儿。
## R语言的优势
R语言的优势在于它不仅是一个开源的编程语言,而且拥有大量的社区支持和丰富的第三
R语言文本挖掘实战:社交媒体数据分析

# 1. R语言与文本挖掘简介
在当今信息爆炸的时代,数据成为了企业和社会决策的关键。文本作为数据的一种形式,其背后隐藏的深层含义和模式需要通过文本挖掘技术来挖掘。R语言是一种用于统计分析、图形表示和报告的编程语言和软件环境,它在文本挖掘领域展现出了强大的功能和灵活性。文本挖掘,简而言之,是利用各种计算技术从大量的
【R语言caret包多分类处理】:One-vs-Rest与One-vs-One策略的实施指南
# 1. R语言与caret包基础概述
R语言作为统计编程领域的重要工具,拥有强大的数据处理和可视化能力,特别适合于数据分析和机器学习任务。本章节首先介绍R语言的基本语法和特点,重点强调其在统计建模和数据挖掘方面的能力。
## 1.1 R语言简介
R语言是一种解释型、交互式的高级统计分析语言。它的核心优势在于丰富的统计包
【R语言数据包mlr的深度学习入门】:构建神经网络模型的创新途径
# 1. R语言和mlr包的简介
## 简述R语言
R语言是一种用于统计分析和图形表示的编程语言,广泛应用于数据分析、机器学习、数据挖掘等领域。由于其灵活性和强大的社区支持,R已经成为数据科学家和统计学家不可或缺的工具之一。
## mlr包的引入
mlr是R语言中的一个高性能的机器学习包,它提供了一个统一的接口来使用各种机器学习算法。这极大地简化了模型的选择、训练
R语言e1071包处理不平衡数据集:重采样与权重调整,优化模型训练

# 1. 不平衡数据集的挑战和处理方法
在数据驱动的机器学习应用中,不平衡数据集是一个常见而具有挑战性的问题。不平衡数据指的是类别分布不均衡,一个或多个类别的样本数量远超过其他类别。这种不均衡往往会导致机器学习模型在预测时偏向于多数类,从而忽视少数类,造成性能下降。
为了应对这种挑战,研究人员开发了多种处理不平衡数据集的方法,如数据层面的重采样、在算法层面使用不同
【R语言Capet包调试与测试】:最佳实践、测试策略与错误处理方法
# 1. R语言Capet包概述
## 1.1 Capet包简介
Capet包是R语言中用于数据科学和统计分析的一个扩展包。它为用户提供了丰富的功能,包括但不限于数据处理、统计分析、机器学习模型的构建和评估等。由于其强大的数据操作能力,Capet包已经成为数据科学家和统计学家不可或缺
资源上传下载、课程学习等过程中有任何疑问或建议,欢迎提出宝贵意见哦~我们会及时处理!
点击此处反馈


专栏目录
最低0.47元/天 解锁专栏
买1年送3个月
百万级
高质量VIP文章无限畅学
千万级
优质资源任意下载
C知道
免费提问 ( 生成式Al产品 )