决策树集成方法揭秘:随机森林与梯度提升机深度探讨
发布时间: 2024-09-08 09:19:41 阅读量: 240 订阅数: 61 

数据分析与模型讲义-决策树随机森林与梯度提升树.pdf
# 1. 决策树集成方法概述
集成学习方法在机器学习领域中占据了举足轻重的地位,它通过组合多个学习器来提升单一学习器的预测性能和泛化能力。决策树集成方法是集成学习的重要分支,其中最著名的有随机森林(Random Forest)和梯度提升机(Gradient Boosting Machine, GBM)。本章我们将从决策树集成方法的整体概述出发,探讨其基础原理、主要优势及其在机器学习中的地位。
## 1.1 决策树集成方法的重要性
集成方法之所以受到广泛关注,是因为它们能够在多个层面上提高机器学习模型的性能。对于分类和回归问题,决策树的集成能够减少模型的方差和偏差,提高模型的准确性。更具体地,集成方法通过减少过拟合的风险,增强了模型对新数据的预测能力。
## 1.2 集成策略的类型
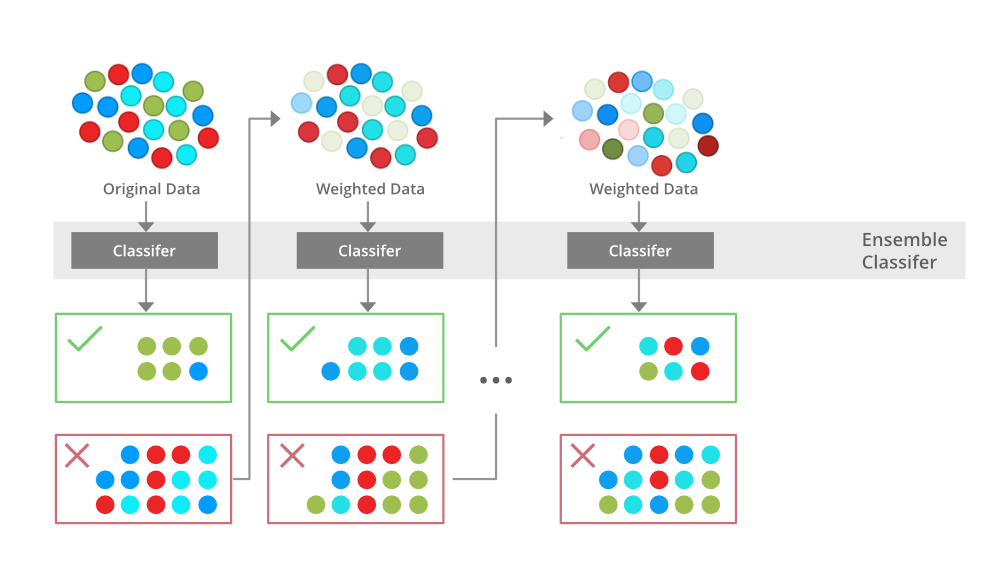
决策树集成方法主要分为两类:Bagging和Boosting。Bagging(Bootstrap Aggregating)通过自助采样方法并行构建多个基学习器,并对结果进行平均或投票,以减少方差。典型代表包括随机森林算法。Boosting则是一种串行过程,它通过顺序构建基学习器,每个学习器都尝试纠正前一个学习器的错误,并赋予前一个学习器更多权重,直至收敛到一个稳定的集成模型。梯度提升机是Boosting策略中的佼佼者。
## 1.3 集成方法在实际中的应用
在实际应用中,集成方法由于其出色的性能被广泛应用于各种场合。例如,在数据科学竞赛如Kaggle中,优秀的参赛者通常会使用随机森林或梯度提升机来解决分类和回归问题。在企业环境中,集成方法也被应用于信用评分、客户细分、欺诈检测等多个领域。
以上所述,决策树集成方法不仅在理论上具有丰富的研究,而且在实践中也显示出强大的应用价值。随着机器学习和人工智能技术的持续进步,集成学习方法将继续在各个领域扮演关键角色。
# 2. 随机森林的理论与实践
## 2.1 随机森林基本原理
### 2.1.1 决策树的构建过程
决策树是机器学习中一种重要的基础模型,它通过一系列的问题将数据集划分为更小的子集,最终形成能够描述数据特征和输出结果的树形结构。构建决策树的过程通常包括以下步骤:
1. **特征选择**:从数据集中选择一个最优特征作为节点,根据该特征的不同取值将数据集分割成子集。最优特征的选择依据是信息增益、基尼不纯度等指标。
2. **决策规则建立**:基于选定的最优特征,计算各个特征值的决策规则,从而将数据集划分成不同的子集。
3. **树的剪枝**:为了避免过拟合,需要对决策树进行剪枝操作,移除一些对最终预测结果贡献较小的分支。
4. **递归构建**:对每个子集重复上述过程,直至满足停止条件(如树达到最大深度、节点中样本数量少于某个阈值等)。
代码实现可以使用Python的`sklearn.tree.DecisionTreeClassifier`类进行示例:
```python
from sklearn.datasets import load_iris
from sklearn.tree import DecisionTreeClassifier
# 加载数据集
iris = load_iris()
X, y = iris.data, iris.target
# 创建决策树分类器实例
clf = DecisionTreeClassifier()
clf.fit(X, y)
# 使用决策树进行预测
predictions = clf.predict(X)
```
### 2.1.2 随机森林的集成策略
随机森林由多个决策树构成,通过引入“袋外估计(Out-Of-Bag, OOB)”和随机特征选择的集成策略,解决了单一决策树容易过拟合的问题。集成策略的关键步骤如下:
1. **数据抽样**:随机森林在构建每棵决策树时,从原始训练集中有放回地随机抽样(bootstrap sample)生成新的训练样本集。
2. **特征随机选择**:对每棵决策树的节点分裂时,不是选择最佳的特征,而是从所有特征中随机选择一部分特征进行分裂。
3. **构建多个决策树**:重复上述步骤,构建多棵决策树,并将它们组合起来形成一个强大的集成模型。
4. **投票机制**:对于分类问题,随机森林中的每棵树对同一个样本进行分类后,采用多数投票的方式进行最终决策;对于回归问题,则采用平均预测值作为最终预测结果。
代码示例:
```python
from sklearn.ensemble import RandomForestClassifier
# 创建随机森林分类器实例
rf_clf = RandomForestClassifier(n_estimators=100, oob_score=True)
rf_clf.fit(X, y)
# 输出袋外估计的准确率
print('OOB Score:', rf_clf.oob_score_)
```
## 2.2 随机森林的算法实现
### 2.2.1 随机森林的特征选择
在随机森林算法中,特征选择是通过随机抽样的方式进行的。这里有一个非常关键的超参数 `mtry`,它表示在每次分裂节点时考虑的特征数量。`mtry`的值通常设置为特征总数的平方根,但这需要根据具体问题进行调整以获得最佳效果。
随机森林模型代码实现时,`mtry` 参数的设定是一个重要的部分:
```python
# 假设我们有10个特征
n_features = 10
mtry = int(n_features ** 0.5) # mtry通常设置为特征数的平方根
# 实际操作中可以使用GridSearchCV来寻找最优的mtry值
```
### 2.2.2 随机森林的参数调优
随机森林模型具有多个可调整的参数,其中最重要的参数包括:树的数量(`n_estimators`)、树的深度(`max_depth`)、`mtry`等。参数调优的过程通常包括以下几个步骤:
1. **确定参数范围**:首先需要对各参数的可能范围有所了解,并根据问题的复杂程度确定搜索范围。
2. **交叉验证**:使用交叉验证的方法评估不同参数组合的模型性能,从而找出最优的参数组合。
3. **网格搜索(Grid Search)**:遍历参数的每个可能值,找出性能最好的一组参数。
一个参数调优的Python代码示例:
```python
from sklearn.model_selection import GridSearchCV
from sklearn.ensemble import RandomForestClassifier
# 设定要搜索的参数范围
param_grid = {
'n_estimators': [10, 50, 100],
'max_depth': [None, 10, 20],
'mtry': [2, 5, 10]
}
# 创建随机森林分类器实例
rf = RandomForestClassifier(oob_score=True)
# 使用GridSearchCV进行参数搜索
grid_search = GridSearchCV(estimator=rf, param_grid=param_grid, cv=3, n_jobs=-1)
grid_search.fit(X, y)
# 输出最佳参数
print("Best parameters found: ", grid_search.best_params_)
```
## 2.3 随机森林的应用案例
### 2.3.1 实际问题中的随机森林应用
随机森林在现实世界的很多问题中都有广泛的应用,比如生物信息学、金融欺诈检测、医疗诊断、推荐系统等。它是一种非常灵活且能够处理非线性关系的算法。
案例研究:某银行希望使用随机森林模型对信用卡申请者进行风险评估。通过收集申请者的各项信息(如年收入、教育背景、工作年限、信用记录等),构建一个随机森林分类器来预测申请者是否有违约的风险。
数据准备:
```python
# 加载数据集
data = pd.read_csv('credit_risk_data.csv')
# 数据预处理(特征工程、清洗等)
# ...
# 分离特征和标签
X = data.drop('default_payment_next_month', axis=1)
y = data['default_payment_next_month']
# 分割数据集为训练集和测试集
from sklearn.model_selection import train_test_split
X_train, X_test, y_train, y_test = train_test_split(X, y, test_size=0.2, random_state=42)
```
模型训练和评估:
```python
from sklearn.metrics import accuracy_score, classification_report
# 使用GridSearchCV优化参数
# ...
# 训练模型
rf_model = grid_search.best_estimator_
rf_model.fit(X_train, y_train)
# 预测
predictions = rf_model.predict(X_test)
# 评估模型
print(classification_report(y_test, predictions))
```
### 2.3.2 结果分析与评估
模型的性能评估是通过多种指标来完成的,主要包括准确率、精确率、召回率、F1分数等。针对上面提到的信用卡违约预测问题,我们可以得到如下指标:
```python
# 输出分类报告
print(classification_report(y_test, predictions))
```
通过评估报告,我们可以对随机森林模型的性能进行深入分析。例如,精确率可以反映模型预测为违约的样本中有多少是真正的违约者,召回率则反映了所有违约者中有多少被模型正确预测出来。
此外,我们还可以

 百万级
高质量VIP文章无限畅学
百万级
高质量VIP文章无限畅学
 千万级
优质资源任意下载
千万级
优质资源任意下载
 C知道
免费提问 ( 生成式Al产品 )
C知道
免费提问 ( 生成式Al产品 )
0
0
相关推荐

专栏简介
本专栏深入探讨了数据挖掘中的决策树算法,从基础概念到高级应用。它提供了决策树模型优化的全面指南,包括参数调整和交叉验证的高级技术。专栏还探讨了大数据环境下决策树面临的挑战,以及专家应对策略。此外,它还介绍了决策树可视化技巧,帮助直观地理解决策过程。专栏还展示了决策树在医疗诊断、市场分析、文本挖掘和网络安全等领域的实际应用。它还探讨了决策树集成方法,如随机森林和梯度提升机,以及贝叶斯决策树和半监督学习等进阶算法。通过深入的案例研究和专家见解,本专栏提供了全面的决策树知识,帮助数据科学家和分析师充分利用这一强大的机器学习工具。
专栏目录
最低0.47元/天 解锁专栏
买1年送3月
百万级
高质量VIP文章无限畅学
千万级
优质资源任意下载
C知道
免费提问 ( 生成式Al产品 )
最新推荐
Ansys Workbench网格划分全攻略:提升仿真实效的关键3步

# 摘要
本文深入探讨了Ansys Workbench中网格划分的理论基础与实战应用。首先概述了网格划分的重要性及其对仿真实效的影响,然后详细介绍了网格质量评估标准与多种网格划分方法。在实战章节中,文章解析了网格划分的具体步骤,并分享了优化技巧及案例分析,包括结构分析和流体动力学仿真。高级功能探索部分讨论了多场耦合仿真中的网格处理、自适应网格划分技术,以及高级网格划分工具的应用
深度图(Depth Map)入门指南:基础知识与应用场景
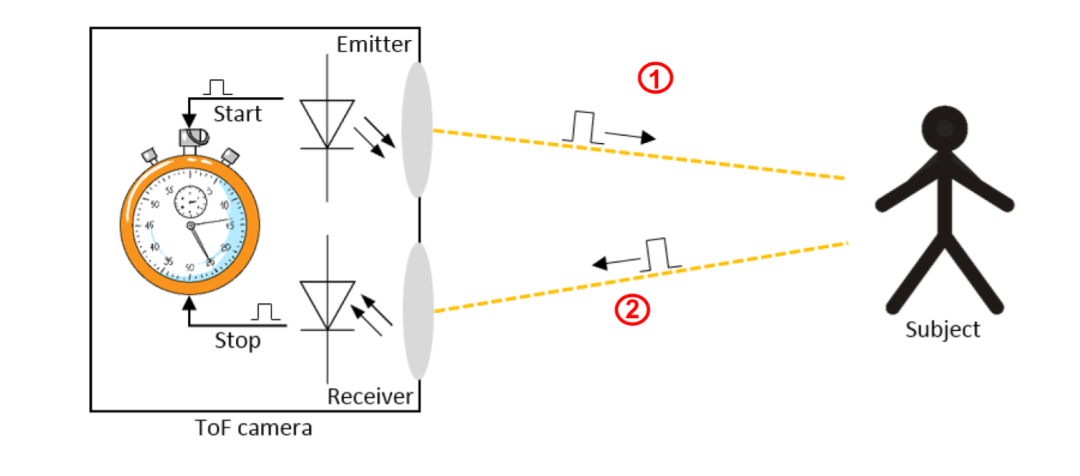
# 摘要
深度图作为一种重要的视觉感知工具,在增强现实(AR)、自动驾驶以及三维重建等多个领域发挥着关键作用。本文首先介绍了深度图的定义及其重要性,然后详细阐述了深度图的基础理论,包括生成原理、数学基础以及常见格式与标准。在深度图处理技术方面,本文探讨了预处理、增强优化、以及融合和多视图重建等方面的技术。通过分析各领域应用案例,本文还阐述了深度图在AR、自动驾驶以及虚拟现实
【一步到位:HP增霸卡配置全面教程】:专业操作与最佳实践

# 摘要
本文系统介绍了HP增霸卡的概念、技术细节及其在不同应用场景中的配置与优化。文章首先概述了HP增霸卡的基础知识,随后深入探讨其技术原理和软硬件协同工作的方式。重点章节详细阐述了配置步骤、性能调优以及配置文件的管理,为用户提供了全面的配置指导。接着,文章提供了故障排除和问题诊断的方法,帮助用户及时发现并解决配置过程中可能出现的问题。此外,本文还分享了最佳实
【高效ICD-10数据管理】:构建专业数据管理策略,提升医疗服务质量

# 摘要
ICD-10数据管理是医疗信息管理的重要组成部分,对于确保医疗记录的标准化、提升数据分析质量和遵循法规至关重要。本文首先概述了ICD-10数据管理的要点,深入解析了ICD-10编码系统的结构、分类和更新维护,以及如何提升编码质量与准确性。接着,本文探讨了数据管理实践,包括数据收集、整理、分
【Magisk青龙面板终极指南】:精通安装、配置与高级优化技巧

# 摘要
本文详细介绍了Magisk和青龙面板的安装、配置以及集成优化,提供了从基础设置到高级功能应用的全面指导。通过分析Magisk的安装与模块管理,以及青龙面板的设置、维护和高级功能,本文旨在帮助用户提升Android系统的可定制性和管理服务器任务的效率。文章还探讨了两者的集成优化,提出了性能监控和资源管理的策略,以及故障诊断和优化措施。案例研究部分展示了
HFSS本征模求解进阶篇:参数化设计与分析的必备知识
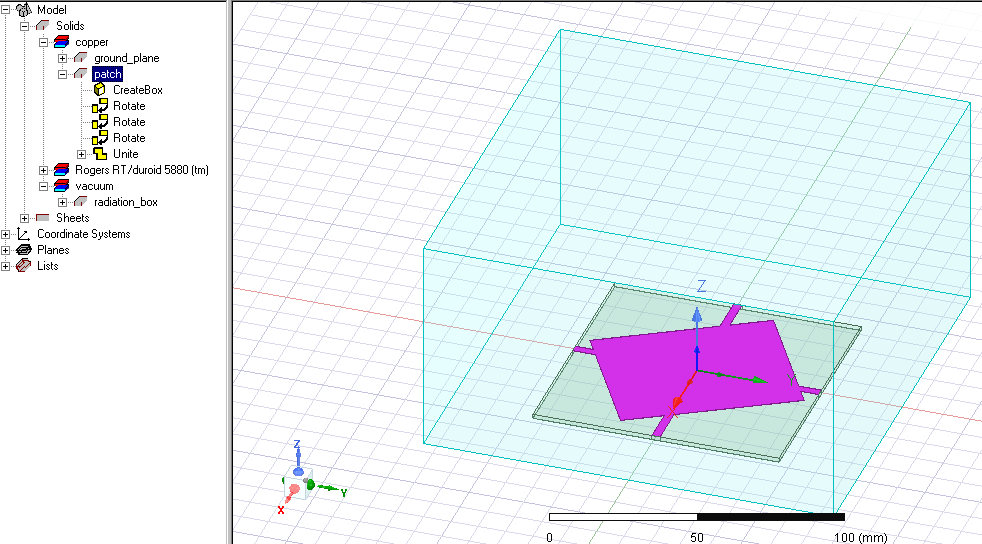
# 摘要
本文系统介绍了HFSS软件在本征模求解、参数化设计、高级分析技巧、自动化与脚本编程以及综合案例分析与实战方面的应用。第一章奠定了HFSS本征模求解的基础理论,第二章深入探讨了参数化设计的核心概念及其在HFSS中的实际运用,包括参数设置与变量管理、设计优化与目标驱动等。第三章详细阐述了HFSS的高级分析技巧,如多物理场耦合分析与本征模求解的高级设置。第四章讨论了HFSS自动化与脚本编程的基本原理和高
T型与S型曲线:哪种更适合你的项目规划?
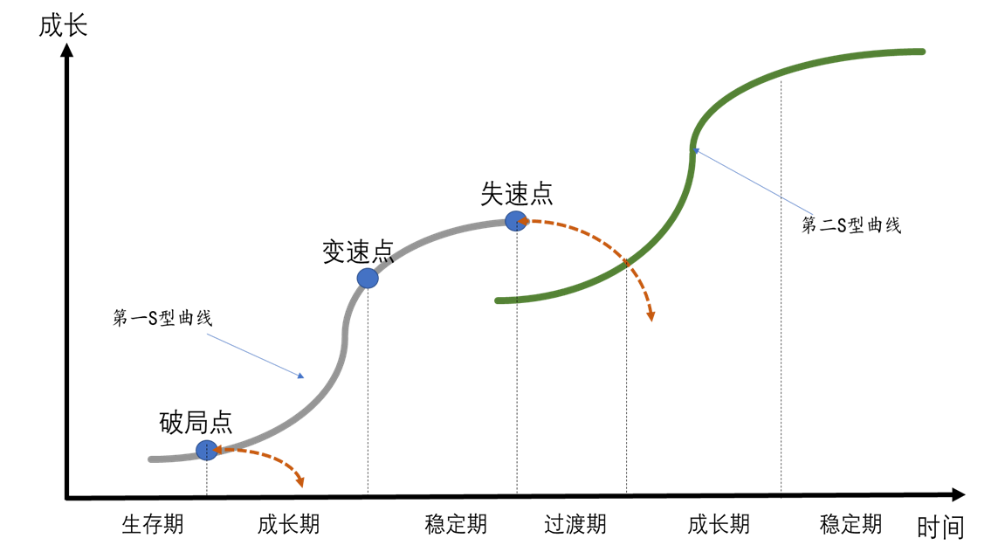
# 摘要
项目规划是确保项目成功的关键环节,本文比较了T型与S型曲线模型在项目规划中的应用和优势。T型曲线模型注重阶段性规划和里程碑设定,而S型曲线强调渐进式规划和持续迭代。通过对两种模型的理论解析、适用场景分析及案例研究,本文阐述了如何根据项目规模、复杂度以及组织文化等因素,选择合适的规划模型,并提出了混合模型实践和优化策略。文章展望了未来项目规划的发展趋势,以及新技术带来的挑战与机遇。
# 关键字
积分概念在数据分析中的角色:如何通过积分优化数据分析流程
# 摘要
积分在数据分析中扮演着至关重要的角色,它不仅作为理论基础广泛应用于数据处理,还通过多种积分方法提升数据处理流程的效率和精确度。本文首先介绍了积分理论的数学基础及其在连续性和离散数据分析中的应用,随后探讨了积分在概率分布中的作用,特别是在统计推断方面的实例。实践案例分析部分展示了如何将积分应用于数据清洗、特征提取和数据预测模型中。高级积分方法与大数据环境的结合,以及积分变换在信
资源上传下载、课程学习等过程中有任何疑问或建议,欢迎提出宝贵意见哦~我们会及时处理!
点击此处反馈


专栏目录
最低0.47元/天 解锁专栏
买1年送3月
百万级
高质量VIP文章无限畅学
千万级
优质资源任意下载
C知道
免费提问 ( 生成式Al产品 )