市场营销策略中的决策树模型:运用技巧与效果评估
发布时间: 2024-09-04 22:25:11 阅读量: 77 订阅数: 48 

预测模型解释介绍面试题解答用法场景说明注意6个事项.docx

# 1. 决策树模型基础介绍
## 1.1 决策树模型概述
决策树是一种机器学习中广泛应用的预测模型,通过一系列的逻辑判断来分割数据特征空间,并最终形成树状结构。它具有直观、易于理解和解释的特点,在分类和回归任务中都有卓越表现。
## 1.2 决策树的工作原理
决策树通过递归地选择最优特征进行分割,构建分支和节点,每个节点代表一个特征或属性上的判断,而分支则代表了判断结果。树的叶节点对应于最终的决策结果,可以是类别标签或数值输出。
## 1.3 决策树的优势与应用
决策树模型的一大优势在于其简洁性和直观性,它无需假设数据符合特定的概率分布,且对异常值较为鲁棒。该模型在金融风险评估、市场营销、医疗诊断等领域有着广泛的应用前景。
# 2. 构建决策树模型
## 2.1 理论基础与构建步骤
### 2.1.1 决策树模型的理论基础
决策树是一种经典的机器学习算法,它模拟人类进行决策的思维过程。该模型通过一系列的判断规则,以树状结构的方式表达出来,其中每一个内部节点代表了一个属性上的判断,分支代表了判断结果的输出,而每个叶节点代表一种分类结果。
构建决策树模型的理论基础主要包括信息增益(Information Gain)、基尼指数(Gini Index)和增益率(Gain Ratio)等。信息增益是基于熵的概念,衡量了一个特征对于数据集混乱度减少的贡献。基尼指数是用于分类问题的另一种分割标准,它是衡量数据集纯度的一种方式。增益率是信息增益的一种变体,它考虑了特征取值的多样性和均衡性。
### 2.1.2 决策树构建的详细步骤
构建决策树模型可以分为以下步骤:
1. **选择最优特征**:根据某种标准(如信息增益、基尼指数或增益率)从所有可用的特征中选择最优特征,用于分割数据集。
2. **划分数据集**:根据最优特征的不同取值对数据集进行划分。
3. **构建子树**:对划分后的数据集递归地执行上述过程,构建出子决策树。
4. **确定终止条件**:递归构建树的过程中,当满足一定的终止条件时停止构建,这些条件可能包括所有特征已经被使用、数据集中的数据都是同一类别或者达到树的最大深度等。
5. **剪枝处理**:为避免过拟合,需要进行剪枝操作,通过去除一些分支来简化树结构。
构建决策树的过程中,选择最优特征是关键步骤,它直接影响到树的结构和预测效果。下面的代码示例展示了使用Python中的决策树算法进行特征选择和构建决策树的逻辑。
```python
from sklearn.datasets import load_iris
from sklearn.tree import DecisionTreeClassifier
# 加载iris数据集
iris = load_iris()
X = iris.data
y = iris.target
# 创建决策树分类器实例
clf = DecisionTreeClassifier(criterion='entropy') # 使用信息增益为分割标准
# 训练模型
clf.fit(X, y)
# 输出决策树模型的结构
print(clf.tree_)
```
在上面的代码中,`criterion='entropy'`参数指定了使用信息增益作为特征选择的标准。通过`fit`方法训练数据,模型会自动进行特征选择和构建决策树。最终,使用`print(clf.tree_)`能够输出模型内部的树结构。
## 2.2 特征选择与数据预处理
### 2.2.1 特征重要性的评估方法
特征选择是机器学习中提高模型性能和解释性的重要环节。决策树模型能够直接给出各个特征的重要性评估,这在特征选择过程中非常有用。
在Scikit-learn中,决策树模型的`feature_importances_`属性可以返回每个特征的重要性评分,该评分是基于特征对模型预测性能的贡献大小进行评估的。特征重要性评分越高,表示该特征对于决策树模型的构建越关键。
```python
import numpy as np
import matplotlib.pyplot as plt
# 获取特征重要性评分
importances = clf.feature_importances_
# 对特征重要性评分进行排序
indices = np.argsort(importances)[::-1]
# 绘制特征重要性图
plt.figure()
plt.title("Feature importances")
plt.bar(range(X.shape[1]), importances[indices], color="r", align="center")
plt.xticks(range(X.shape[1]), [iris.feature_names[i] for i in indices], rotation=90)
plt.xlim([-1, X.shape[1]])
plt.show()
```
上述代码段首先获取了决策树模型的特征重要性评分,并对其进行了排序。然后使用`matplotlib`绘制了一个条形图来可视化特征的重要性。
### 2.2.2 数据清洗和预处理技术
在应用决策树模型之前,数据预处理是不可或缺的一步。数据预处理包括数据清洗、数据转换和数据规约等步骤,目的是提高数据质量,提升模型的预测性能。
数据清洗包括处理缺失值、异常值和重复记录等。数据转换通常涉及归一化或标准化,确保每个特征在相同的尺度上进行比较。数据规约可以通过特征选择或降维技术来减少数据集中的变量数量。
使用Python进行数据预处理的常见库包括`pandas`用于数据操作和`scikit-learn`用于数据预处理技术。下面的代码示例展示了一个简单的数据清洗流程:
```python
import pandas as pd
from sklearn.model_selection import train_test_split
from sklearn.impute import SimpleImputer
# 加载数据
data = pd.read_csv('data.csv')
# 处理缺失值
imputer = SimpleImputer(strategy='mean') # 使用均值填充缺失值
data_imputed = pd.DataFrame(imputer.fit_transform(data))
# 处理异常值(示例:假设数据中的第1列有异常值)
data_clean = data_imputed[(data_imputed[0] > data_imputed[0].quantile(0.01)) &
(data_imputed[0] < data_imputed[0].quantile(0.99))]
# 分割数据集为训练集和测试集
X = data_clean.iloc[:, :-1] # 特征数据
y = data_clean.iloc[:, -1] # 目标变量
X_train, X_test, y_train, y_test = train_te
```

 百万级
高质量VIP文章无限畅学
百万级
高质量VIP文章无限畅学
 千万级
优质资源任意下载
千万级
优质资源任意下载
 C知道
免费提问 ( 生成式Al产品 )
C知道
免费提问 ( 生成式Al产品 )
0
0
相关推荐

专栏简介
本专栏深入探讨了决策树模型的评估和优化技术。涵盖了特征选择、不平衡数据处理、集成学习、评估指标、大数据挑战、Kappa统计量、推荐系统优化和图像识别中的应用。通过对这些主题的全面分析,该专栏为数据科学家和机器学习从业者提供了宝贵的见解,帮助他们构建和评估高效、准确的决策树模型。
专栏目录
最低0.47元/天 解锁专栏
买1年送3月
百万级
高质量VIP文章无限畅学
千万级
优质资源任意下载
C知道
免费提问 ( 生成式Al产品 )
最新推荐
Cyclone数据持久化策略:持久层最佳实践,数据安全无忧

# 摘要
本文首先概述了Cyclone数据持久化的基本概念及其在软件系统中的核心作用。随后深入探讨了数据持久化的理论基础,包括数据库事务的ACID属性、数据一致性和备份与灾难恢复策略。接着,文章详细阐述了Cyclone持久层的设计原则与核心组件,并通过案例分析展示其实践应用和优化策略。此外,本文还强调了数据安全性的重要性,探讨了数据安全的挑战、数据完整性和安全性增强措施。最后,本文讨论了性能优化和监控在Cyclone持久化
提升仪器控制效率:高级VISA函数编程技巧大揭秘
# 摘要
VISA(Virtual Instrument Software Architecture)是一种标准的I/O接口软件,广泛应用于自动化测试与测量领域中仪器通信的编程和控制。本文从VISA的基本概念和函数编程基础开始,详细探讨了VISA函数的安装、配置、基本语法及其在实现仪器通信中的应用。进阶章节深入讲解了高级编程技巧,包括高级通信控制技术、编写可复用代码的方法以及处理复杂仪器协议。随后,本文展示了V
代码与文档同步更新指南:协同工作流的优化之道

# 摘要
在现代软件开发中,代码与文档的同步更新对于保持项目信息一致性、提高工作效率和质量至关重要。本文强调了协同工作流中理论与实践的重要性,并探讨了实施同步更新的挑战和进阶策略。文章通过分析协同工作流的理论基础,包括定义、工作流角色、同步更新的理论模型以及自动化工具的应用,为实现高效同步更新提供了理论支持。实践案例部分则深入探讨了工具选择、工作流程设计、操作挑战及
【工程标准的IT实践】:ANSI SAE花键案例研究
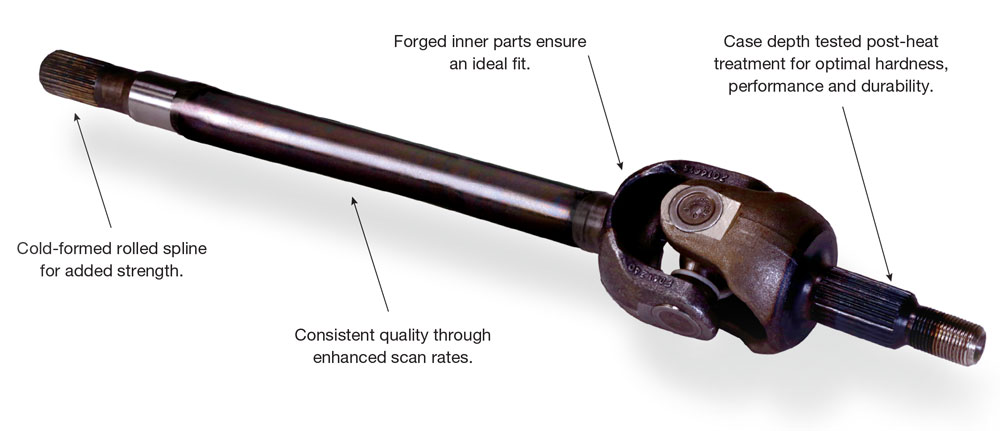
# 摘要
本文详细探讨了ANSI SAE花键的设计、工程标准以及在工程实践中的实现,并分析了IT技术在提升花键工程标准实践中的作用。文章首先概述了ANSI SAE花键的标准及其在工程设计中的重要性,并详细讨论了设计和制造流程的具体标准要求。随后,文章转向工程实践,研究了花键加工技术和质量检验流程,并通过案例分析展示了花键在不同行业中的应用。第四章重点介绍了C
彻底解析:S7-200 Smart与KEPWARE的OPC通信协议精髓
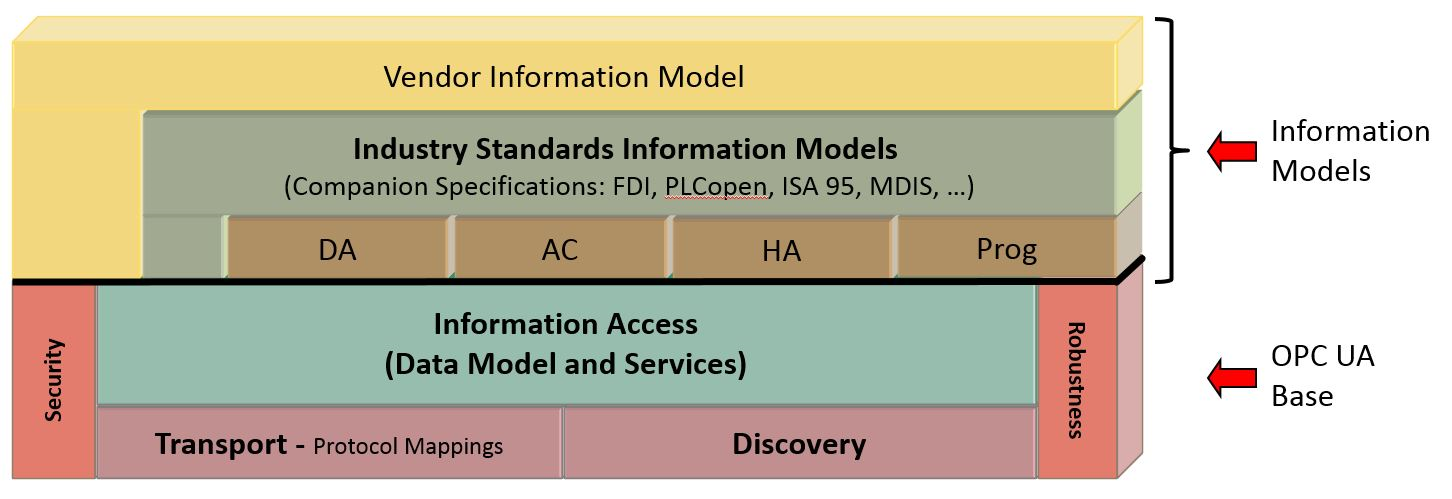
# 摘要
本论文系统地探讨了S7-200 Smart PLC与OPC(OLE for Process Control)技术在工业自动化领域的通信实现。介绍了OPC通信协议的基础知识,包括其发展历程、架构组成以及数据访问规范。同时,详细阐述了S7-200 Smart PLC的硬件特点和编程实践,以及如何使用KEPWARE OPC服务器进行有效配置和管理。本文还展示了如何实现S
【数字电位器工作原理揭秘】:掌握其工作模式与应用

# 摘要
数字电位器是一种电子元件,用于调节电路中的电压或电流。本文首先介绍数字电位器的基本概念和功能,然后深入探讨其工作模式,包括内部结构、工作原理、主要参数和特性。接着,本文分析数字电位器的应用实例,如电路设计、信号调节和电子设备中的应用。此外,本文还讨论了数字电位器的编程与控制方法,以及调试和性能优化策略。最后,本文展望了数字电位器的未来发展趋势,包括技术创新和应用前景,并
【质量控制策略】:确保GMW14241翻译无误的关键措施

# 摘要
本文旨在深入探讨GMW14241标准的翻译质量控制流程,以及如何通过翻译实践技巧确保翻译准确性。首先,文章概述了GMW14241标准,并分析了翻译流程中质量控制的重要性及其基本原则。随后,重点介绍了翻译质量评估体系、翻译工具和技术运用以及翻译团队的管理与培训。在确保翻译准确性方面,探讨了汽车行业特定术语的理解与应用、翻译质量控制的实施步骤以及翻译错误的预防与纠正措施。最后,通过案例研究,分析了GM
【组态王历史数据管理】:优化存储与查询的4大方法
# 摘要
组态王系统在工业自动化领域中扮演着重要角色,尤其在历史数据的管理上。本文首先概述了组态王系统以及历史数据的重要性。随后,深入探讨了历史数据存储的理论基础,包括数据存储基本概念、数据库技术的应用,以及数据压缩技术。在历史数据查询方面,本文分析了查询效率的影响因素、数据仓库与OLAP技术,以及大数据技术在查询优化中的应用。接着,本文讨论了历史数据管理优化方法实践,包括存储结构优化、查询性能提升以及数据安全和备份。高级应用章节则聚焦于实时数据分析、预测性维护和自动化报告生成。最后,本文展望了未来趋势与技术创新,特别关注人工智能、云计算融合以及数据安全性与合规性的发展方向。文章综合应用理论与
【CAN2.0布线实务与OSI模型】:硬件连接到通信层次的全面指导
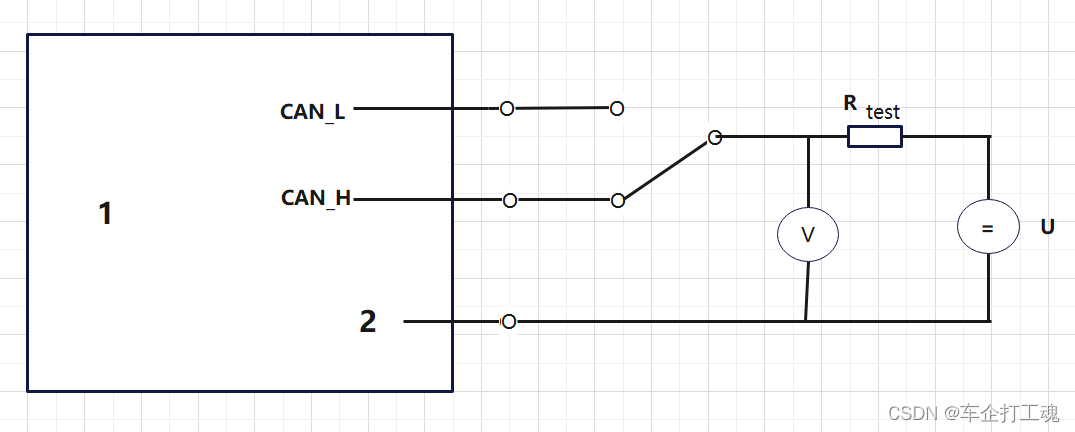
# 摘要
本论文全面介绍了CAN2.0总线技术,涵盖了其基础理论、布线标准、实践应用、与OSI模型的关系、网络配置及故障排除,以及布线的高级应用和创新。通过详细探讨CAN2.0的布线基础和实践,包括线材规格选择、布线长度布局、接地屏蔽技术及端接电阻配置,本文为实现可靠和高效的CAN2.0通信网络提供了重要指导。此外,论文深入分析了OSI模型与CAN2.0的相互作用,并探讨了在
资源上传下载、课程学习等过程中有任何疑问或建议,欢迎提出宝贵意见哦~我们会及时处理!
点击此处反馈


专栏目录
最低0.47元/天 解锁专栏
买1年送3月
百万级
高质量VIP文章无限畅学
千万级
优质资源任意下载
C知道
免费提问 ( 生成式Al产品 )