评估决策树模型:交叉验证、AUC-ROC曲线与混淆矩阵详解
发布时间: 2024-09-04 21:39:14 阅读量: 96 订阅数: 48 

Applied-Machine-Learning

# 1. 决策树模型概述
在当今数据驱动的时代,决策树模型作为机器学习领域中的一项基础且强大的工具,广泛应用于分类和回归问题。决策树模拟人类决策过程,通过一系列简单的判断规则对数据进行分割,从而实现对未知数据的预测。尽管其原理简单,但决策树在处理复杂数据结构时表现出色,尤其在数据可视化和模型解释性方面具备显著优势。本章旨在为读者提供决策树模型的基础知识,包括其工作原理、类型以及应用场景,为接下来深入分析模型评估方法论和实践应用打下坚实的基础。
# 2. 评估决策树模型的方法论
### 2.1 交叉验证的理论基础
#### 2.1.1 交叉验证的概念与分类
交叉验证(Cross-Validation)是一种统计学上用来评估并提高统计分析准确性的方式,它通过把原始数据分成训练集和验证集,以评估模型对独立数据集的预测能力。
**分类**:
- 留一交叉验证(Leave-One-Out Cross-Validation, LOOCV):每次留出一个样本作为验证集,其余作为训练集,重复进行模型训练和验证,直到每个样本都被验证过一次。
- K折交叉验证(K-Fold Cross-Validation):将数据集分为K个大小相似的互斥子集,每个子集尽可能保持数据分布的一致性。每次留一个子集作为验证集,其余作为训练集,重复K次,最终取K次验证结果的平均值作为模型的性能指标。
交叉验证方法的选择依赖于数据集的大小和模型的计算成本。LOOCV适用于数据量大的情形,而K折交叉验证在样本数量有限的情况下更加高效。
```python
from sklearn.model_selection import KFold
# 设置K折交叉验证的参数
kf = KFold(n_splits=5, shuffle=True, random_state=42)
for train_index, test_index in kf.split(X):
X_train, X_test = X[train_index], X[test_index]
y_train, y_test = y[train_index], y[test_index]
# 这里可以进行模型训练和评估
```
#### 2.1.2 交叉验证在模型评估中的作用
交叉验证允许数据的有效利用,减少因分割数据集带来的随机性影响,从而获得一个更稳健的模型性能指标。
它主要具有以下作用:
- **减少方差**:多次分割数据集并进行模型验证,可以减少评估结果的方差,使得模型性能评估更为稳定。
- **评估模型泛化能力**:通过多次训练和验证过程,可以估计模型对未知数据的预测能力。
- **超参数调优**:在模型选择和超参数调整时,使用交叉验证可以避免模型的过拟合,并为最佳超参数的选择提供依据。
### 2.2 AUC-ROC曲线的理论与实践
#### 2.2.1 AUC-ROC曲线的基本原理
ROC曲线(接收者操作特征曲线)是反映二分类模型性能的图形化工具,横坐标为假正类率(False Positive Rate, FPR),纵坐标为真正类率(True Positive Rate, TPR)。曲线下的面积(Area Under Curve, AUC)是一个介于0到1之间的值,AUC值越高,表明分类器的性能越好。
#### 2.2.2 AUC-ROC曲线的计算方法和意义
计算AUC值主要分为以下几个步骤:
1. 对于不同的分类阈值,计算出每个阈值对应的TPR和FPR。
2. 以FPR为横坐标,TPR为纵坐标绘制曲线。
3. 计算曲线下的面积即AUC值。
AUC值的意义在于提供了一个不依赖于特定分类阈值的模型性能指标,可以用来比较不同模型的性能。
```python
from sklearn.metrics import roc_curve, auc
# 假设y_true是实际标签,y_scores是模型预测的概率
fpr, tpr, thresholds = roc_curve(y_true, y_scores)
roc_auc = auc(fpr, tpr)
# 绘制ROC曲线
import matplotlib.pyplot as plt
plt.figure()
plt.plot(fpr, tpr, color='darkorange', lw=2, label='ROC curve (area = %0.2f)' % roc_auc)
plt.plot([0, 1], [0, 1], color='navy', lw=2, linestyle='--')
plt.xlim([0.0, 1.0])
plt.ylim([0.0, 1.05])
plt.xlabel('False Positive Rate')
plt.ylabel('True Positive Rate')
plt.title('Receiver Operating Characteristic')
plt.legend(loc="lower right")
plt.show()
```
### 2.3 混淆矩阵的深度解析
#### 2.3.1 混淆矩阵的构建与组成
混淆矩阵是一个表格,用于描述分类器在每种类别上的性能表现,它包括真正类(True Positives, TP)、假正类(False Positives, FP)、假负类(False Negatives, FN)和真负类(True Negatives, TN)四个部分。
#### 2.3.2 混淆矩阵指标的解读和应用
通过混淆矩阵,我们可以计算出一系列指标来评估模型的性能,如准确率(Accuracy)、精确率(Precision)、召回率(Recall)和F1分数等。
- **准确率**:分类正确的样本占总样本的比例,Accuracy = (TP+TN)/(TP+FP+TN+FN)。
- **精确率**:预测为正的样本中实际为正的比例,Precision = TP/(TP+FP)。
- **召回率**:实际为正的样本中被预测为正的比例,Recall = TP/(TP+FN)。
- **F1分数**:精确率和召回率的调和平均值,F1 = 2*(Precision*Recall)/(Precision+Recall)。
准确率在数据不平衡的情况下可能会有误导性,而精确率、召回率和F1分数可以提供更全面的性能评估。
```python
from sklearn.metrics import confusion_matrix, accuracy_score, precision_score, recall_score, f1_score
# 假设y_true是实际标签,y_pred是模型预测的标签
cm = confusion_matrix(y_true, y_pred)
accuracy = accuracy_score(y_true, y_pred)
precision = precision_score(y_true, y_pred)
recall = recall_score(y_true, y_pred)
f1 = f1_score(y_true, y_pred)
```
以上章节内容介绍了交叉验证、AUC-ROC曲线和混淆矩阵等在评估决策树模型时的理论基础与实践应用。接下来的章节将详细介绍如何在实践中应用交叉验证来优化模型评估流程,并深入探讨AUC-ROC曲线和混淆矩阵在实际问题中的应用。
# 3. 交叉验证的实践应用
## 3.1 选择交叉验证的策略
交叉验证是一种强大的技术,用于评估并提高机器学习模型在独立数据上的表现。选择正确的交叉验证策略至关重要,因为它可以防止模型过度拟合训练数据,以及确保模型的泛化能力。
### 3.1.1 K折交叉验证的实操
K折交叉验证将数据集分为K个大小相等的子集,每个子集轮流作为验证集,其余作为训练集。这种方法可以保证每个数据点都被用作一次验证集。
#### 操作步骤:
1. 导入必要的库:
```python
from sklearn.model_selection import KFold
from sklearn.linear_model import LogisticRegression
from sklearn.metrics import accuracy_score
```
2. 初始化模型和交叉验证对象:
```python
kf = KFold(n_splits=5)
model = LogisticRegression()
```
3. 进行K折交叉验证:
```python
for train_index, test_index in kf.split(X):
X_train, X_test = X[train_index], X[test_index]
y_train, y_test = y[train_index], y[test_index]
model.fit(X_train, y_train)
predictions = model.predict(X_test)
print(accuracy_score(y_test, predictions))
```
#### 代码逻辑解读:
- `KFold`类用于生成K折交叉验证的分割。
- `n_splits=5`指定了K的值为5。
- 在循环中,每次迭代都会生成一组训练和测试索引。
- 使用`model.fit()`在训练数据上拟合模型。
- 通过`model.predict()`在测试数据上生成预测,并用准确率评估模型。
### 3.1.2 留一交叉验证与随机子样本方法
留一交叉验证是K折交叉验证的特例,其中K等于样本数量。尽管计算量大,但它为每个样本提供了独立的验证,有助于评估模型在极端情况下的性能。随机子样本方法则涉及随机选择一定比例的数据作为验证集。
#### 留一交叉验证的代码示例:
```python
from sklearn.model_selection import LeaveOneOut
l
```

 百万级
高质量VIP文章无限畅学
百万级
高质量VIP文章无限畅学
 千万级
优质资源任意下载
千万级
优质资源任意下载
 C知道
免费提问 ( 生成式Al产品 )
C知道
免费提问 ( 生成式Al产品 )
0
0
相关推荐

专栏简介
本专栏深入探讨了决策树模型的评估和优化技术。涵盖了特征选择、不平衡数据处理、集成学习、评估指标、大数据挑战、Kappa统计量、推荐系统优化和图像识别中的应用。通过对这些主题的全面分析,该专栏为数据科学家和机器学习从业者提供了宝贵的见解,帮助他们构建和评估高效、准确的决策树模型。
专栏目录
最低0.47元/天 解锁专栏
买1年送3月
百万级
高质量VIP文章无限畅学
千万级
优质资源任意下载
C知道
免费提问 ( 生成式Al产品 )
最新推荐
GR-1221-CORE协议深度解读:掌握网络工程的10个关键点
# 摘要
GR-1221-CORE协议是通信领域内关键的标准协议之一,其概述、理论基础、关键点详解、实践应用、高级应用以及挑战构成了本文的研究核心。本文首先介绍了GR-1221-CORE协议的起源、发展以及结构组成,并探讨了其关键技术概念,如服务质量和安全机制。随后深入解读了协议在连接建立、信令控制、故障管理等方面的细节。文章进一步讨论了协议在不同网络场景下的部署、性
【仓库管理系统的数据导航】:深入理解数据流与逻辑流分析

# 摘要
本文深入探讨了仓库管理系统的数据导航技术,详细阐述了数据流和逻辑流的理论基础、实践应用以及集成技术。通过分析数据流的定义、类型、模型构建及逻辑流的设计、测试与维护,本文为仓库管理系统提供了详实的理论支持和实践指导。同时,本文还强调了数据安全和隐私保护在仓库管理系统中的核心地位,并探讨了未来数据流与逻辑流技术的发展趋势,包括大数据技术应用及智能化仓储的发
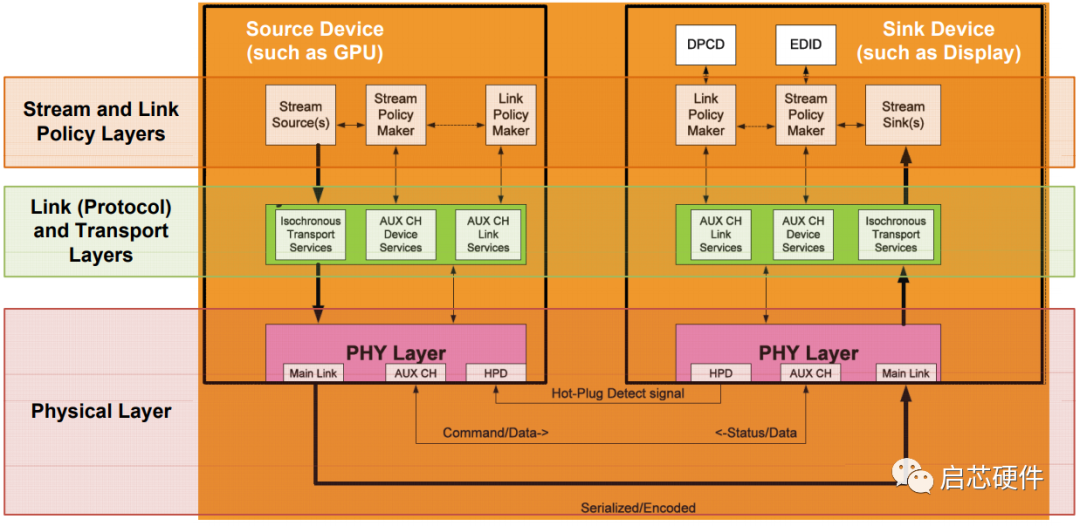
【高清媒体同步】:USB 3.0在音视频传输中的应用与优化

# 摘要
USB 3.0技术作为高速数据传输接口,为高清音视频传输提供了理论基础和实践应用的可能性。本文首先概述了USB 3.0技术,随后深入探讨了其在音视频同步与数据传输中的关键作用,包括音频和视频数据的特性分析、传输原理及其同步机制。在实践应用章节,文章分析了音视频设备的连接配置、同步实
【数据中心网络管理】:LLDP在高密度环境中的部署与优化
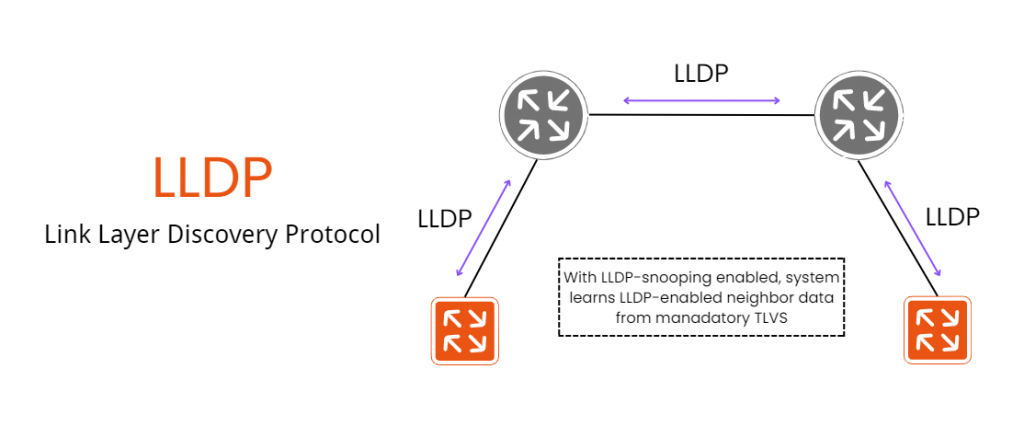
# 摘要
随着数据中心网络规模的不断扩大和复杂度的增加,网络管理成为一项挑战。LLDP协议作为网络管理的重要组成部分,对提高网络设备的互操作性和管理效率发挥着重要作用。本文首先概述数据中心网络管理的基础,然后深入解析LLDP协议的工作原理及其配置和使用场景。接着,针对高密度环境的特点,探讨了LLDP的部署策略,包括网络发现和网络拓扑管理等方面的挑战与解决方案。文章还介绍了LLDP优化实践,涉及性能调优和监控系统
Unity光照效果教程:手把手教你制作无卡顿的光晕动画

# 摘要
本文系统地探讨了Unity引擎中光照效果的设计和实现,从基础概念到高级技术应用,涵盖了Unity光照组件的特性、动态光照及阴影、光晕动画制作和性能优化等多个方面。文章深入解析了各种光源组件的种类与特性,讲解了全局光照、光照贴图和烘焙技术,并着重介绍了光晕动画的制作流程和优化策略
【流程绩效指标库应用】:APQC框架在IT行业的实施攻略

# 摘要
APQC框架作为一种在IT行业中促进流程绩效管理的标准化方法论,提供了结构化的指导原则和工具,以便组织能够有效地衡量和改进其业务流程。本文首先介绍了APQC框架的理论基础,包括其核心要素以及如何构建与组织效率紧密相关的流程绩效指标库。随后,探讨了APQC框架在实践中的应用,包括如何选择和定义流程绩效指标,如何测量和监控流程绩效,以及如何通过持续改进来提升业务流
【硬件信号质量与时序基础】:如何从新手到专家优化测试与分析策略
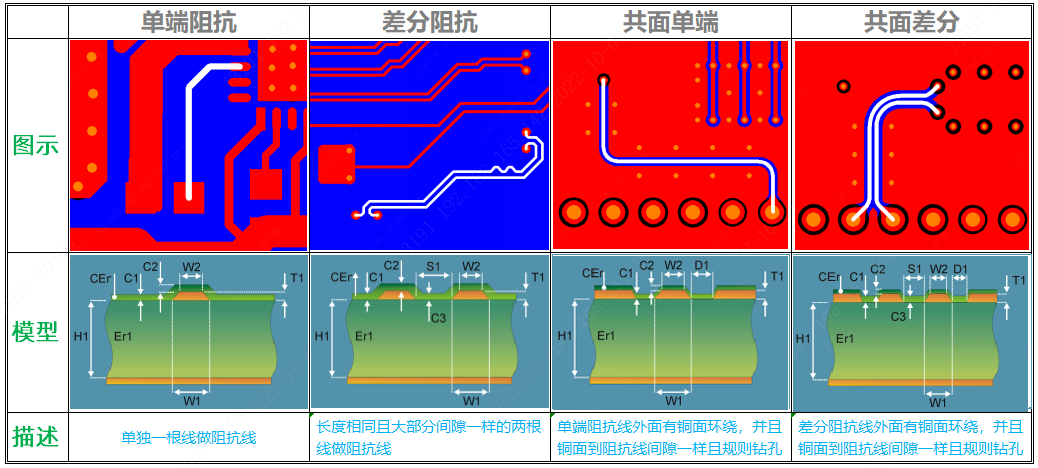
# 摘要
本文旨在深入探讨硬件信号质量与时序的理论基础、测量技术、优化策略以及高级技术挑战。首先介绍了信号质量的关键参数和时序理论概念,然后详述了信号质量和时序的测量技术,包括使用各种测量设备与分析方法。接着,本文重点探讨了提升硬件信号质量和优化时序的有效方法,并通过案例研究展示了故障诊断与调试的实际应用。最后,文章展望了未来在测试方法、跨领域技术融合以及系统级信号与时
【VScode C++环境配置】:从零开始,逐步成为调试高手

# 摘要
随着软件开发复杂性的增加,高效的开发环境配置对于提升开发效率和项目质量至关重要。本文全面介绍了Visual Studio Code(VSCode)作为C++开发环境的优势及基础配置。首先,文章对VSCode界面布局、基本操作和C++扩展安装进行了详细的讲解,随后深入探讨了如何在VSCode中创建和管理C++项目,包括项目结构规划和调试工具的配置。进一步地,文章通过实践案例分享了代码编写、
洗衣机模糊控制系统的设计原则与最佳实践
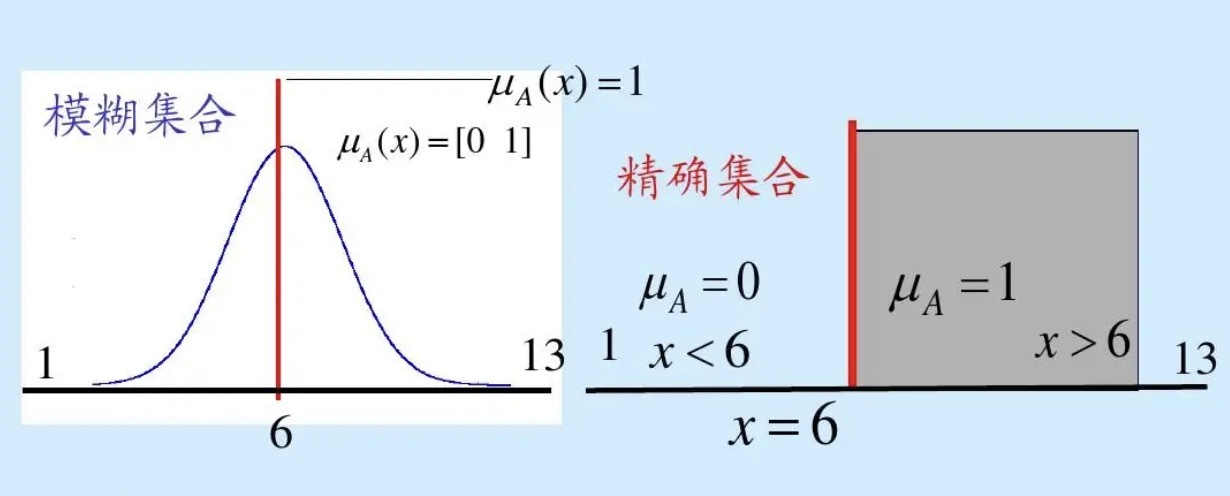
# 摘要
本文综述了洗衣机模糊控制系统的概念、理论基础、实现细节、案例研究以及未来发展趋势。首先介绍了洗衣机模糊控制系统的概况,然后详细阐述了模糊逻辑和控制器设计的理论基础。接着,本文深入探讨了模糊控制算法的实现、传感器集成以及用户界面的设计。通过案例研究,分析了模糊逻辑在洗衣程序中的应用和系统性能测试结果。最终,展望了模糊控制系统与智能家居、物联网、人工智能以及绿色节能技术的融合前景,提出了系统未来的发展方向。
# 关键字
模糊控制;洗衣机;模糊
资源上传下载、课程学习等过程中有任何疑问或建议,欢迎提出宝贵意见哦~我们会及时处理!
点击此处反馈


专栏目录
最低0.47元/天 解锁专栏
买1年送3月
百万级
高质量VIP文章无限畅学
千万级
优质资源任意下载
C知道
免费提问 ( 生成式Al产品 )