决策树模型参数调优:网格搜索与贝叶斯优化的最佳实践
发布时间: 2024-09-04 22:05:39 阅读量: 141 订阅数: 48 

【java毕业设计】智慧社区教育服务门户.zip
# 1. 决策树模型参数调优基础
决策树模型因其简单直观而广泛应用于分类和回归问题。然而,为了达到最佳的预测效果,对其进行参数调优是必不可少的步骤。本章将探讨决策树参数调优的基础知识,包括关键参数的作用、如何正确设置参数以防止过拟合或欠拟合等问题。我们将从以下几个方面展开:
## 1.1 决策树模型参数概述
决策树模型有许多参数,主要可以分为三类:树结构参数、剪枝参数和叶节点的不纯度度量参数。结构参数如`max_depth`、`min_samples_split`和`min_samples_leaf`影响树的深度和复杂性,剪枝参数如`max_leaf_nodes`和`min_impurity_decrease`用于控制树的过度拟合。不纯度度量参数如`criterion`定义了如何测量节点不纯度。
## 1.2 参数调优的基本策略
调优参数时,首先需要确定参数搜索的范围和可能的值,可以使用网格搜索方法,以穷举的方式测试所有组合。另一种方法是随机搜索,它在预定义的参数分布中随机选择参数值。此外,还可以根据经验或先前的实验结果缩小搜索范围,采用启发式方法,如贝叶斯优化来更智能地选择参数。
## 1.3 避免过拟合和欠拟合
避免决策树的过拟合和欠拟合是参数调优的关键目标。通过设置适当的`max_depth`和`min_samples_split`可以避免过拟合,而适当的`min_samples_leaf`可以平衡模型的复杂度和泛化能力。通过交叉验证来评估模型性能,是检测和避免这些问题的有效方法。
了解了决策树模型参数调优的基础,第二章我们将深入探讨网格搜索的理论与实践,如何通过Python实现参数优化。
# 2. 网格搜索的理论与实践
## 2.1 网格搜索概念及原理
### 2.1.1 参数调优的目标和意义
在机器学习中,模型的性能往往依赖于正确的参数选择。这些参数,又称为超参数,包括但不限于学习率、树的数量、树的深度等。超参数的选取对模型的性能有着决定性的影响。参数调优的目标是找到这些超参数的最佳组合,从而使得模型在给定的数据集上具有最佳的泛化能力。
调优的意义在于:
1. 提高模型的准确率:通过找到最佳的超参数组合,可以显著提高模型对未知数据的预测准确性。
2. 减少模型的过拟合风险:合适的参数可以帮助模型更好地泛化,避免在训练数据上过度拟合。
3. 优化计算资源:合理选择参数可以减少模型训练的时间和计算资源,提高开发和部署效率。
### 2.1.2 网格搜索的工作流程
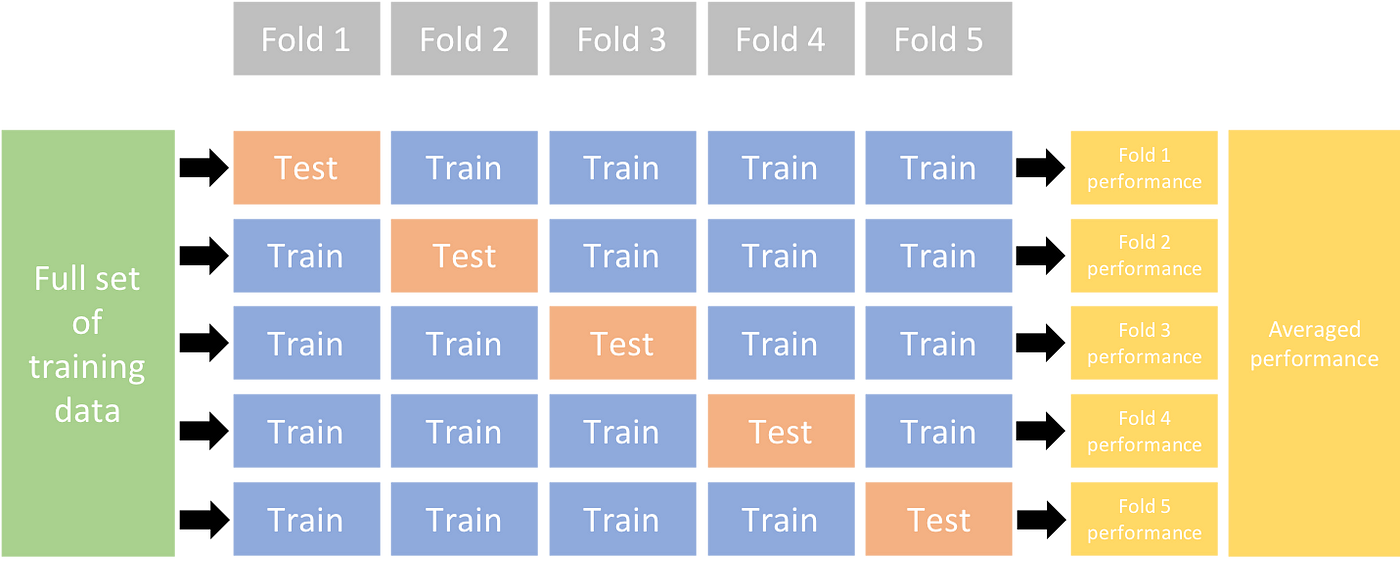
网格搜索(Grid Search)是一种参数调优的方法,其基本思想是定义一个参数的网格,然后遍历这些参数的所有组合,使用交叉验证的方法来评估每一个参数组合,最后选出最优参数组合。
网格搜索的工作流程如下:
1. 设计参数网格:确定要优化的参数和每个参数可能取值的集合。
2. 生成参数组合:穷举所有可能的参数组合。
3. 交叉验证评估:对每个参数组合使用交叉验证来评估模型的性能。
4. 选择最优参数:根据交叉验证的结果,选取最优的参数组合。
### 2.1.3 代码实现与逻辑分析
下面是一个使用Python的`GridSearchCV`模块进行网格搜索的代码示例:
```python
from sklearn.model_selection import GridSearchCV
from sklearn.ensemble import RandomForestClassifier
from sklearn.datasets import load_digits
# 加载数据集
digits = load_digits()
X, y = digits.data, digits.target
# 定义模型
model = RandomForestClassifier()
# 定义参数网格
param_grid = {
'n_estimators': [100, 200, 300],
'max_depth': [10, 20, 30],
'min_samples_split': [2, 5, 10]
}
# 创建GridSearchCV实例
grid_search = GridSearchCV(estimator=model, param_grid=param_grid, cv=5)
# 拟合GridSearchCV
grid_search.fit(X, y)
# 输出最优参数组合
print("Best parameters found: ", grid_search.best_params_)
```
代码逻辑分析:
- `from sklearn.model_selection import GridSearchCV`:导入`GridSearchCV`模块,这是进行网格搜索的核心工具。
- `from sklearn.ensemble import RandomForestClassifier`:导入随机森林分类器模型,我们将使用这个模型进行参数优化。
- `digits = load_digits()`:加载sklearn内置的手写数字数据集。
- `param_grid = {'n_estimators': [100, 200, 300], 'max_depth': [10, 20, 30], 'min_samples_split': [2, 5, 10]}`:定义参数网格,包括森林中的树的数量、树的最大深度和内部节点再划分所需的最小样本数。
- `grid_search = GridSearchCV(estimator=model, param_grid=param_grid, cv=5)`:创建一个`GridSearchCV`的实例,其中`estimator`是要进行参数优化的模型,`param_grid`是参数网格,`cv=5`表示使用5折交叉验证。
- `grid_search.fit(X, y)`:对数据集应用网格搜索,拟合模型。
- `print("Best parameters found: ", grid_search.best_params_)`:输出找到的最优参数组合。
## 2.2 网格搜索的实现方法
### 2.2.1 使用Python的GridSearchCV
`GridSearchCV`是scikit-learn库提供的一个强大的参数调优工具,它通过组合不同的参数值,自动对这些参数值的所有组合进行模型的训练和评估,最终返回最佳的参数组合。
使用`GridSearchCV`的关键步骤如下:
1. 导入`GridSearchCV`模块,并指定要优化的模型。
2. 定义参数网格,为每个超参数指定一系列可能的值。
3. 实例化`GridSearchCV`类,传入模型、参数网格和交叉验证的折数。
4. 调用`fit`方法,让`GridSearchCV`遍历所有参数组合,并对每个组合进行交叉验证评估。
5. 使用`best_params_`属性获取最优参数组合。
### 2.2.2 自定义网格搜索策略
虽然`GridSearchCV`非常方便,但在某些情况下可能需要更灵活的搜索策略。自定义网格搜索涉及到手动遍历参数组合,并对每个组合进行交叉验证。
以下是自定义网格搜索的一个例子:
```python
from sklearn.model_selection import cross_val_score
from sklearn.ensemble import RandomForestClassifier
# 假设的参数网格
param_grid = {
'n_estimators': [100, 200],
'max_depth': [10, 20]
}
# 定义模型
model = RandomForestClassifier()
# 自定义网格搜索
best_score = -1
best_params = {}
for n_estimators in param_grid['n_estimators']:
for max_depth in param_grid['max_depth']:
model.set_params(n_estimators=n_estimators, max_depth=max_depth)
scores = cross_val_score(model, X, y, cv=5)
mean_score = scores.mean()
if mean_score > best_score:
best_score = mean_score
best_params = {'n_estimators': n_estimators, 'max_depth': max_depth}
print("Best parameters found: ", best_params)
```
在这段代码中,我们手动遍历参数网格,对于每一个参数组合,使用`cross_val_score`函数进行5折交叉验证,并记录下最佳的参数组合。自定义网格搜索方法给予了开发者更大的灵活性,但同时也需要更多的代码实现工作。
## 2.3 网格搜索的性能优化
### 2.3.1 减少搜索空间的策略
由于网格搜索需要遍历所有参数组合,参数的数量越多,搜索空间就越大,计算成本也越高。因此,采取措施减少搜索空间是性能优化的关键。减少搜索空间的策略包括:
- 使用知识或经验来缩小参数范围。
- 通过预实验或快速原型评估确定最有希望的参数范围。
- 使用更精细的步长在重点区域搜索

 百万级
高质量VIP文章无限畅学
百万级
高质量VIP文章无限畅学
 千万级
优质资源任意下载
千万级
优质资源任意下载
 C知道
免费提问 ( 生成式Al产品 )
C知道
免费提问 ( 生成式Al产品 )
0
0
相关推荐

专栏简介
本专栏深入探讨了决策树模型的评估和优化技术。涵盖了特征选择、不平衡数据处理、集成学习、评估指标、大数据挑战、Kappa统计量、推荐系统优化和图像识别中的应用。通过对这些主题的全面分析,该专栏为数据科学家和机器学习从业者提供了宝贵的见解,帮助他们构建和评估高效、准确的决策树模型。
专栏目录
最低0.47元/天 解锁专栏
买1年送3月
百万级
高质量VIP文章无限畅学
千万级
优质资源任意下载
C知道
免费提问 ( 生成式Al产品 )
最新推荐
【本土化术语详解】:GMW14241中的术语本土化实战指南

# 摘要
术语本土化作为国际交流与合作的关键环节,在确保信息准确传达及提升用户体验中扮演重要角色。本文深入探讨了GMW14241术语本土化的理论与实践,阐述了本土化的目标、原则、语言学考量以及标准化的重要性。文中详述了本土化流程的规划与实施,本土化术语的选取与调整,以及质量控制的标准和措施。案例分析部分对成功本土化的术语进行实例研究,讨论了本土化过程中遇到的挑战及其解决方案,并提出了在实际应用中的反馈与持续改进策略。未
持续集成中文档版本控制黄金法则

# 摘要
随着软件开发流程的日益复杂,持续集成和版本控制成为提升开发效率和产品质量的关键实践。本文首先介绍了持续集成与版本控制的基础知识,探讨了不同版本控制系统的优劣及其配置。随后,文章深入解
Cyclone进阶操作:揭秘高级特性,优化技巧全攻略

# 摘要
Cyclone是一种注重安全性的编程语言,本论文首先概述了Cyclone的高级特性,深入解析了其核心概念,包括类型系统、并发模型和内存管理。接着,提供了实践指南,包括高级函数与闭包、模块化编程和构建部署策略。文章进一步探讨了优化技巧与性能调优,涵盖性能监控、代码级别和系统级别的优化。此外,通过分析实际项目案例,展示了Cyclone在
三菱MR-JE-A伺服电机网络功能解读:实现远程监控与控制的秘诀

# 摘要
本文对三菱MR-JE-A伺服电机的网络功能进行了全面的探讨。首先,介绍了伺服电机的基础知识,然后深入讨论了网络通信协议的基础理论,并详细分析了伺服电机网络功能的框架及其网络安全性。接着,探讨了远程监控的实现方法,包括监控系统架构和用户交互界面的设计。文章还探讨了远程控制的具体方法和实践,包括控制命令
【从图纸到代码的革命】:探索CAD_CAM软件在花键加工中的突破性应用

# 摘要
随着制造业的快速发展,CAD/CAM软件的应用逐渐兴起,成为提高设计与制造效率的关键技术。本文探讨了CAD/CAM软件的基本理论、工作原理和关键技术,并分析了其在花键加工领域的具体应用。通过对CAD/CAM软件工作流程的解析和在花键加工中设计与编程的案例分析,展现了其在提高加工精度和生产效率方面的创新应用。同时,文章展望了CAD/CAM软件未来的发展趋势,重
【S7-200 Smart通信编程秘笈】:通过KEPWARE实现数据交互的极致高效

# 摘要
本文详细探讨了S7-200 Smart PLC与KEPWARE通信协议的应用,包括KEPWARE的基础知识、数据交互、优化通信效率、故障排除、自动化项目中的应用案例以及深度集成与定制化开发。文章深入解析了KEPWARE的架构、工作原理及与PLC的交互模式,并比较了多种工业通信协议,为读者提供了选择指南。同时,介绍了数据映射规则、同步实现、通信效率优化的技巧和故障排除方法。此外,文章还
【CAN2.0网络设计与故障诊断】:打造高效稳定通信环境的必备指南
# 摘要
本文系统地介绍了CAN2.0网络的基础知识、硬件设计、协议深入解析、故障诊断技术、性能优化以及安全防护措施。首先概述了CAN2.0网络的技术基础,接着详细探讨了其硬件组成和设计原则,包括物理层设计、控制器与收发器选择以及网络拓扑结构的构建。文章深入解析了CAN协议的数据封装、时间触发与容错机制,并探讨了其扩展标准。针对网络故障,本文提供了诊断理论、工具使用和案例分析的详细讨论。最后,文章针
VISA函数实战秘籍:测试与测量中的高效应用技巧
# 摘要
VISA(虚拟仪器软件架构)函数库在测试测量领域中扮演着关键角色,它为与各种测试仪器的通信提供了一套标准的接口。本文首先介绍了VISA函数库的基础知识,包括其作用、组成、适用范围以及安装与配置的详细步骤。接着,本文通过编程实践展示了如何利用VISA函数进行数据读写操作和状态控制,同时也强调了错误处理和日志记录的
【完美转换操作教程】:一步步Office文档到PDF的转换技巧

# 摘要
本文旨在提供关于Office文档到PDF格式转换的全面概览,从Office软件内置功能到第三方工具的使用技巧,深入探讨了转换过程中的基础操作、高级技术以及常见问题的解决方法。文章分析了在不同Office应用(Word, Excel, PowerPoint)转换为PDF时的准备工作、操作步骤、格式布局处理和特定内容的兼容性。同时,文中还探讨了第三方软件如
【组态王自动化脚本编写】:提高效率的12个关键脚本技巧

# 摘要
组态王自动化脚本作为一种高效的自动化编程工具,在工业自动化领域中扮演着关键角色。本文首先概述了组态王自动化脚本的基本概念及其在实践中的应用。接着,深入探讨了脚本基础,包括选择合适的脚本语言、脚本组件的使用、以及脚本错误处理方法。本文重点介绍了脚本优化技巧,涵盖代码重构、性能提升、可维护性增强及安全性考虑。通过案例分析,文中展示了组态王脚本在数据处理、设备控制和日志管理等实际应用中的效果。最后,本文展望了组态王脚本的进阶技术及未来发展趋势,提供了一系列先进技术和解决方
资源上传下载、课程学习等过程中有任何疑问或建议,欢迎提出宝贵意见哦~我们会及时处理!
点击此处反馈


专栏目录
最低0.47元/天 解锁专栏
买1年送3月
百万级
高质量VIP文章无限畅学
千万级
优质资源任意下载
C知道
免费提问 ( 生成式Al产品 )