图像识别中的数据增强技巧
发布时间: 2024-09-01 13:50:12 阅读量: 146 订阅数: 93 
# 1. 图像识别技术概述
在当今数字化时代,图像识别技术已成为一个迅速发展的研究领域。图像识别是指使用计算机技术从图像中提取有用信息的过程,它涉及到模式识别、计算机视觉和机器学习等多个技术领域。图像识别技术在自动驾驶、医学诊断、安防监控等众多行业都有着广泛的应用。
图像识别技术的核心是图像分类和物体检测。图像分类主要是判断图像属于哪个类别,如判断一张图片是山川还是河流;而物体检测则更进一步,在判断图像类别之外,还要确定物体在图像中的位置,通常使用边界框来标记。随着深度学习技术的快速发展,卷积神经网络(CNNs)已成为实现复杂图像识别任务的主流方法。它们通过模拟人脑对视觉信息的处理方式,能够自动学习图像的特征,实现高准确率的识别任务。
# 2. 数据增强的理论基础
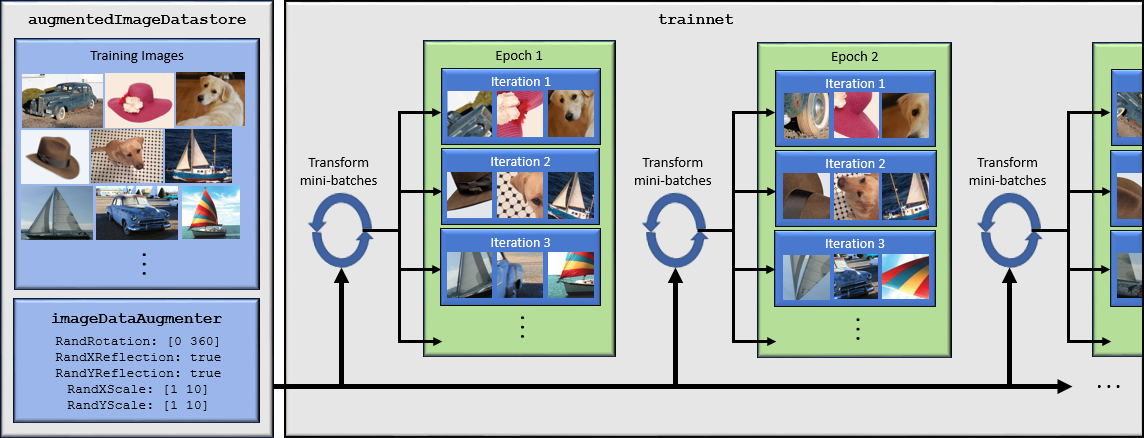
数据增强是提升机器学习模型泛化能力和鲁棒性的重要手段,在图像识别任务中尤为关键。由于实际获取的图像数据集往往有限,并且具有一定的偏差,因此,通过数据增强技术人为地扩充和变化数据集,不仅可以增加训练样本的多样性,还可以有效地减少过拟合现象,提高模型对未见示例的预测性能。
## 2.1 数据增强在图像识别中的重要性
### 2.1.1 提升模型泛化能力
模型的泛化能力是指模型对未知数据的预测能力,这是评估一个模型好坏的最重要指标之一。通过数据增强,可以在不改变图像基本类别的前提下,通过各种变换生成新的图像样本,增加模型的训练数据多样性。这种增加的多样性有助于模型学习到更鲁棒的特征,从而在面对新的、未见过的图像时能够做出更准确的判断。
### 2.1.2 扩充训练集的多样性
在机器学习领域,一个常见的问题是训练数据不足。尤其是图像数据,标注工作既费时又费力,因此数据集往往有限。数据增强可以在原有数据集的基础上,通过各种变换生成新的训练样本,有效扩充数据集,从而提升模型的训练效果。这一点对于那些因资源限制而难以获得大规模标注数据的场景尤为重要。
## 2.2 数据增强的主要方法和效果
### 2.2.1 基本变换技术:平移、缩放、旋转、翻转
这些变换是最基础也是最常用的数据增强方法。通过对图像进行平移操作,可以模拟物体在不同位置的情况;缩放操作可以增加模型对物体大小变化的敏感性;旋转则模拟了物体在不同方向的观察视角;翻转操作则可以模拟物体的镜像变化。这些方法简单高效,易于实现,能够显著提升模型对于空间变换的鲁棒性。
```python
import numpy as np
import cv2
from matplotlib import pyplot as plt
# Load an image
image = cv2.imread('example.jpg')
# Translation
rows, cols = image.shape[:2]
M = np.float32([[1, 0, 50], [0, 1, 50]])
translated = cv2.warpAffine(image, M, (cols, rows))
# Scaling
M_scale = cv2.getRotationMatrix2D((cols/2, rows/2), 45, 1)
scaled = cv2.warpAffine(image, M_scale, (cols, rows))
# Rotation
rotated = cv2.warpAffine(image, M_scale, (cols, rows))
# Flipping
flipped = cv2.flip(image, 1)
# Display the original and transformed images
fig = plt.figure(figsize=(10, 8))
plt.subplot(2, 3, 1)
plt.imshow(cv2.cvtColor(image, cv2.COLOR_BGR2RGB))
plt.title("Original Image")
plt.subplot(2, 3, 2)
plt.imshow(cv2.cvtColor(translated, cv2.COLOR_BGR2RGB))
plt.title("Translated Image")
plt.subplot(2, 3, 3)
plt.imshow(cv2.cvtColor(scaled, cv2.COLOR_BGR2RGB))
plt.title("Scaled Image")
plt.subplot(2, 3, 4)
plt.imshow(cv2.cvtColor(rotated, cv2.COLOR_BGR2RGB))
plt.title("Rotated Image")
plt.subplot(2, 3, 5)
plt.imshow(cv2.cvtColor(flipped, cv2.COLOR_BGR2RGB))
plt.title("Flipped Image")
plt.show()
```
### 2.2.2 颜色空间变化:亮度调整、对比度调整、饱和度变化
图像在颜色空间上的变化同样重要,因为现实世界中的图像往往会因光照、视角等因素而呈现不同的颜色表现。亮度调整可以模拟不同的光照条件;对比度调整可以改善模型对物体边界的识别能力;饱和度变化则模拟了不同颜色的丰富度。这些变化能够在不影响图像类别属性的前提下,增加图像的多样性。
```python
# Brightness Adjustment
alpha_b = 1.5 # Controls the brightness
beta_b = 0 # Controls the darkness
bright_image = cv2.convertScaleAbs(image, alpha=alpha_b, beta=beta_b)
# Contrast Adjustment
alpha_c = 1.5 # Controls the contrast
beta_c = 0
contrast_image = cv2.convertScaleAbs(image, alpha=alpha_c, beta=beta_c)
# Saturation Adjustment
# Here we convert the image to HSV and then modify the saturation channel
hsv_image = cv2.cvtColor(image, cv2.COLOR_BGR2HSV)
h, s, v = cv2.split(hsv_image)
s = cv2.multiply(s, alpha_s).astype(np.uint8) # alpha_s is the saturation scale factor
sat_image = cv2.merge([h, s, v])
sat_image = cv2.cvtColor(sat_image, cv2.COLOR_HSV2BGR)
# Display the brightness, contrast and saturation adjusted images
fig = plt.figure(figsize=(12, 4))
plt.subplot(1, 3, 1)
plt.imshow(cv2.cvtColor(bright_image, cv2.COLOR_BGR2RGB))
plt.title("Brightness Adjusted")
plt.subplot(1, 3, 2)
plt.imshow(cv2.cvtColor(contrast_image, cv2.COLOR_BGR2RGB))
plt.title("Contrast Adjusted")
plt.subplot(1, 3, 3)
plt.imshow(cv2.cvtColor(sat_image, cv2.COLOR_BGR2RGB))
plt.title("Saturation Adjusted")
plt.show()
```
### 2.2.3 深度变换技术:噪声注入、模糊处理
深度变换技术可以模拟真实世界中图像可能遭遇的各种干扰。噪声注入可以增加模型对图像噪声的抵抗能力;模糊处理则可以训练模型在图像不清晰的情况下仍能识别出关键特征。这些技术使得模型对于图像质量的变化更为不敏感,从而提高了模型的健壮性。
```python
# Noise Injection
mean = 0
var = 0.1
noise = np.random.normal(mean, var ** 0.5, image.shape)
noise_image = image + noise
noise_image = np.clip(noise_image, 0, 255).astype(np.uint8)
# Gaussian Blur
blur_image = cv2.GaussianBlur(image, (5,5), 0)
# Display the noise injected and blurred images
fig = plt.figure(figsize=(10, 4))
plt.subplot(1, 2, 1)
plt.imshow(cv2.cvtColor(noise_image, cv2.COLOR_BGR2RGB))
plt.title("Noise Injected")
plt.subplo
```

 百万级
高质量VIP文章无限畅学
百万级
高质量VIP文章无限畅学
 千万级
优质资源任意下载
千万级
优质资源任意下载
 C知道
免费提问 ( 生成式Al产品 )
C知道
免费提问 ( 生成式Al产品 )
0
0
相关推荐

专栏简介
本专栏深入探讨了图像识别算法的实现步骤,从数据准备到模型训练,涵盖了图像预处理技术、使用 Python 和 TensorFlow 构建图像识别系统、数据增强技巧、损失函数选择、正则化技术、高级特征提取技巧、Keras 和迁移学习的使用、性能评估、激活函数、API 构建、并行计算和 GPU 加速、注意力机制、多尺度处理技巧、端到端训练流程、模型压缩和优化以及实时性能优化。专栏旨在为读者提供全面且实用的指南,帮助他们理解和构建高效的图像识别算法。
最低0.47元/天 解锁专栏
买1年送3月
百万级
高质量VIP文章无限畅学
千万级
优质资源任意下载
C知道
免费提问 ( 生成式Al产品 )
最新推荐
【ABB变频器深度解析】:掌握ACS510型号的全部秘密
# 摘要
本文全面介绍了ABB变频器ACS510型号,包括其硬件组成、工作原理、软件控制、配置及高级应用实例。首先概述了ACS510型号的基本信息,随后详细分析了其硬件结构、工作机制和关键技术参数,并提供了硬件故障诊断与维护策略。接着,本文探讨了软件控制功能、编
AMESim液压仿真优化宝典:提升速度与准确性的革新方法
# 摘要
AMESim作为一种液压仿真软件,为工程设计提供了强大的模拟和分析工具。本文第一章介绍了AMESim的基础知识和液压仿真技术的基本概念。第二章深入探讨了AMESim仿真模型的构建方法,包括系统建模理论、模型参数设置以及信号与控制的处理。第三章重点描述了提高AMESim仿真实效性的策略和高级分析技术,以及如何解读和验证仿真结果。第四章通过案例研究,展示了AMESim在实际工程应用中的优化效果、故障诊断
【性能与兼容性的平衡艺术】:在UTF-8与GB2312转换中找到完美的平衡点
# 摘要
字符编码是信息处理的基础,对计算机科学和跨文化通讯具有重要意义。随着全球化的发展,UTF-8和GB2312等编码格式的正确应用和转换成为技术实践中的关键问题。本文首先介绍了字符编码的基本知识和重要性,随后详细解读了UTF-8和GB2312编码的特点及其在实际应用中的作用。在此基础上,文章深入探讨了字符编码转换的理论基础,包括转换的必要性、复
【Turbo Debugger新手必读】:7个步骤带你快速入门软件调试

# 摘要
本文旨在全面介绍软件调试工具Turbo Debugger的使用方法和高级技巧。首先,本文简要概述了软件调试的概念并提供了Turbo Debugger的简介。随后,详细介绍了Turbo Debugger的安装过程及环境配置的基础知识,以确保调试环境的顺利搭建。接着,通过详细的操作指南,让读者能够掌握项目的加
【智能小车控制系统优化秘籍】:揭秘路径记忆算法与多任务处理

# 摘要
智能小车控制系统涉及路径记忆算法与多任务处理的融合,是提高智能小车性能和效率的关键。本文首先介绍了智能小车控制系统的概念和路径记忆算法的理论基础,然后探讨了多任务处理的理论与实践,特别关注了实时操作系统和任务调度机制。接着,文章深入分
SUN2000逆变器MODBUS扩展功能开发:提升系统灵活性的秘诀
# 摘要
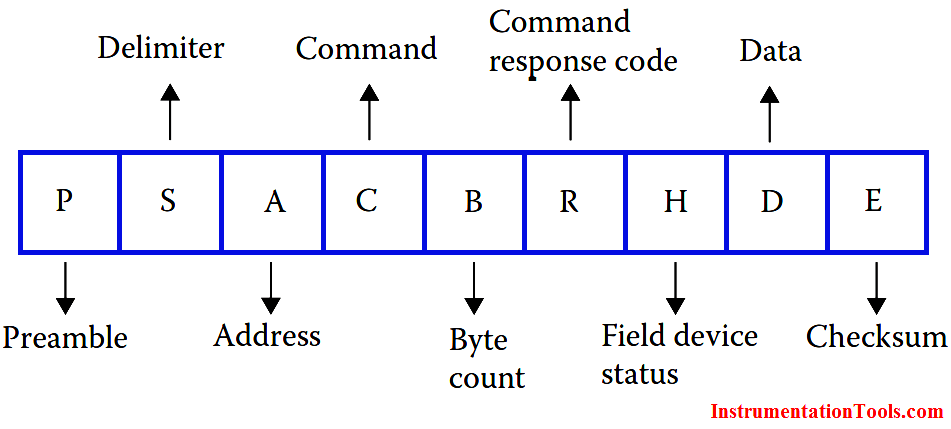
本文针对MODBUS协议在SUN2000逆变器中的应用及逆变器通信原理进行了深入探讨。首先介绍了MODBUS协议的基础知识以及逆变器通信原理,随后详细分析了SUN2000逆变器MODBUS接口,并解读了相关命令及功能码。接着,文章深入探讨了逆变器数据模型和寄存器映
【cantest高级功能深度剖析】:解锁隐藏功能的宝藏

# 摘要
cantest作为一种先进的测试工具,提供了一系列高级功能,旨在提升软件测试的效率与质量。本文首先概览了cantest的核心功能,并深入探讨了其功能架构,包括核心组件分析、模块化设计以及插件系统的工作原理和开发管理。接着,文章实战演练了cantest在数据驱动测试、跨平台测试和自动化测试框架
【系统稳定性提升】:sco506升级技巧与安全防护

# 摘要
本文全面介绍了sco506系统的概述、稳定性重要性、升级前的准备工作,以及系统升级实践操作。文中详细阐述了系统升级过程中的风险评估、备份策略、升级步骤以及验证升级后稳定性的方法。此外,文章还探讨了系统安全防护策略,包括系统加固、定期安全审计与
期末考试必看:移动互联网数据通信与应用测试策略
# 摘要
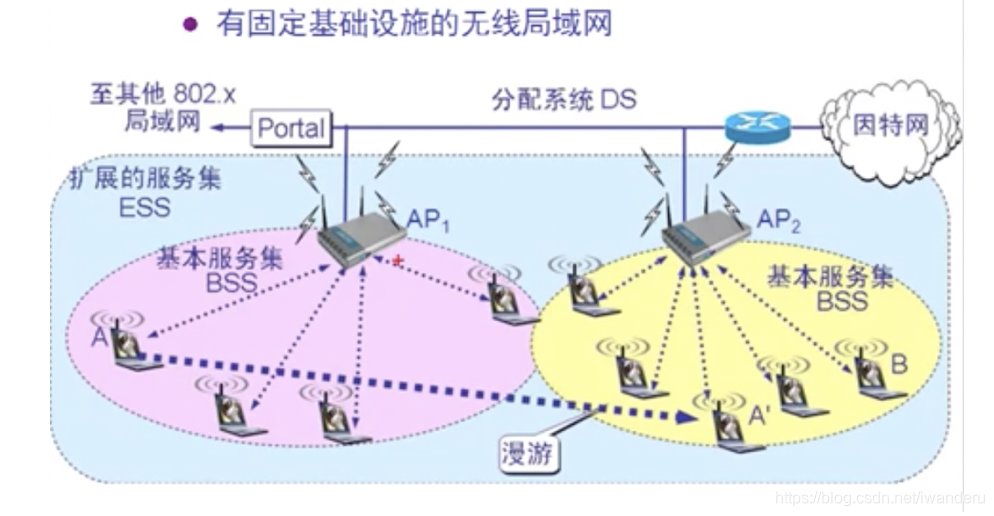
随着移动互联网的快速发展,数据通信和移动应用的测试与性能优化成为提升用户体验的关键。本文首先介绍了移动互联网数据通信的基础知识,随后详述了移动应用测试的理论与
【人事管理系统性能优化】:提升系统响应速度的关键技巧:性能提升宝典
# 摘要
随着信息技术的迅速发展,人事管理系统的性能优化成为提升组织效率的关键。本文探讨了系统性能分析的基础理论,包括性能分析的关键指标、测试方法以及诊断技术。进一步,本文涉及系统架构的优化实践,涵盖了数据库、后端服务和前端界面的性能改进。文章还深入讨论了高级性能优化技术,包括分布式系统和云服务环境下的性能管理,以及使用性能优化工具与自动化流程。最
资源上传下载、课程学习等过程中有任何疑问或建议,欢迎提出宝贵意见哦~我们会及时处理!
点击此处反馈


专栏目录
最低0.47元/天 解锁专栏
买1年送3月
百万级
高质量VIP文章无限畅学
千万级
优质资源任意下载
C知道
免费提问 ( 生成式Al产品 )