【自动驾驶中的图像识别】:技术挑战与最新进展
发布时间: 2024-09-06 12:40:01 阅读量: 308 订阅数: 110 

图像识别技术的进展和应用.pdf
# 1. 自动驾驶与图像识别基础
自动驾驶技术的发展离不开图像识别,它为汽车提供了一双能够“看懂”周围环境的眼睛。本章旨在为读者提供自动驾驶和图像识别基础的概览,以便更好地理解后续章节中更为专业和深入的内容。
## 1.1 自动驾驶与图像识别的交融
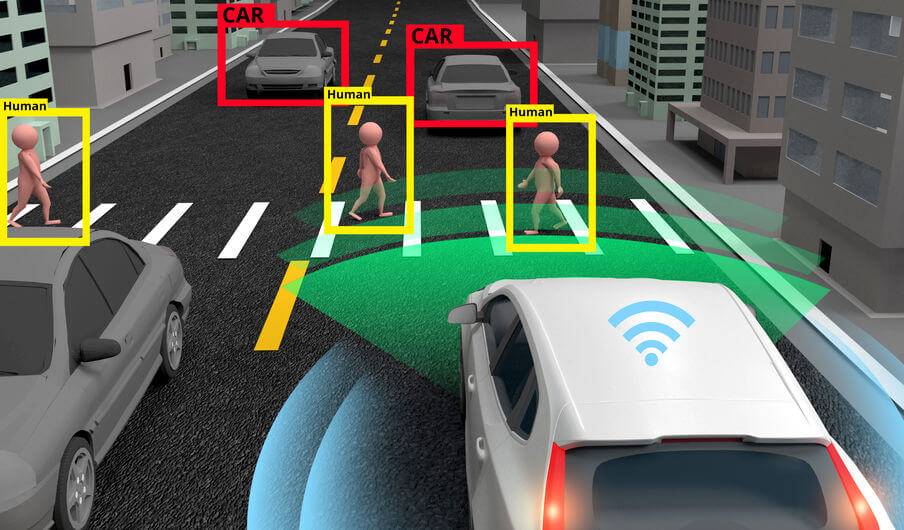
自动驾驶汽车依靠多种传感器收集周围环境的数据,图像识别技术在这些传感器中占据核心地位。通过安装在车辆上的摄像头,可以捕捉实时视频流,这些图像数据为汽车提供了识别其他车辆、行人、交通标识和道路情况的能力。
## 1.2 图像识别技术的重要性
图像识别技术让自动驾驶系统可以有效地理解视觉信息,并且做出安全和正确的决策。无论是识别障碍物以避免碰撞,还是解读交通灯的变化以调整行驶速度,图像识别都发挥着不可或缺的作用。
为了实现可靠的自动驾驶,图像识别算法需要处理各种天气条件和光照变化所带来的影响,并且必须拥有高速处理图像数据的能力以满足实时性要求。这些挑战推动了图像识别技术的快速发展。
通过理解这些基础概念,读者将为学习后续章节中更高级的图像处理、机器学习和深度学习技术打下坚实的基础。
# 2. 图像识别技术的理论基础
## 2.1 图像处理的基本概念
### 2.1.1 图像的数字化和表示方法
数字化是将现实世界的图像转换成计算机可以处理的格式的过程。在数字化的过程中,我们通常使用位图(raster)图像,它由一系列称为像素的小单元组成。每个像素都有特定的位置和值,通常是颜色值,用数字表示。在数字图像中,最简单的表示方法是使用二值化,即只有黑白两种颜色。更复杂的图像则使用灰度值,即从黑色到白色的连续色调。最常见的彩色图像表示方法是RGB模型,它通过红色、绿色和蓝色光的强度组合来创建其他颜色。
代码块演示了如何在Python中使用Pillow库来创建和保存一个简单的数字化图像:
```python
from PIL import Image, ImageDraw
# 创建一个新的白色图像
width, height = 100, 100
image = Image.new('RGB', (width, height), 'white')
# 创建绘图对象
draw = ImageDraw.Draw(image)
# 在图像上绘制一个黑色方块
draw.rectangle([30, 30, 70, 70], fill='black')
# 保存图像
image.save('digital_image.png')
```
在上述代码中,我们首先导入了Pillow库的相关模块。然后,我们使用`Image.new`函数创建了一个新的图像对象,该对象是一个100x100像素的白色图像。接下来,我们创建了一个绘图对象`draw`,它允许我们在这个空白图像上绘制。我们使用`draw.rectangle`方法在图像上绘制了一个黑色的方块,指定方块的左上角坐标为`(30, 30)`,右下角坐标为`(70, 70)`。最后,我们使用`image.save`方法将图像保存到磁盘上。
### 2.1.2 图像的增强与滤波技术
图像增强是图像处理中的一个重要领域,用于提高图像质量或改善视觉效果。通过图像增强技术,我们可以强化图像中的某些特征,例如对比度和亮度,或者应用滤波技术来减少图像噪声或者突出图像中特定的结构。常见的图像增强方法包括直方图均衡化、图像锐化、平滑滤波、边缘检测等。
以下是一个使用直方图均衡化增强图像的例子:
```python
from PIL import Image, ImageEnhance
# 打开原始图像
original_image = Image.open('original_image.jpg')
# 应用直方图均衡化
enhanced_image = ImageEnhance.Contrast(original_image).enhance(1.5)
# 保存增强后的图像
enhanced_image.save('enhanced_image.jpg')
```
在这个代码示例中,我们首先打开了一个名为`original_image.jpg`的原始图像。然后我们使用`ImageEnhance.Contrast`来获取一个增强器对象,通过调用该对象的`enhance`方法并传入一个值(此处为1.5),我们增强了图像的对比度。最后,增强后的图像被保存为`enhanced_image.jpg`。
### 2.1.3 图像滤波与去噪
图像滤波是处理图像噪声的过程,目的是改善图像质量。滤波通常涉及对图像中每个像素应用一个窗口(即局部邻域)上的函数。常见的滤波算法包括均值滤波、高斯滤波和中值滤波等。
以下是一个使用中值滤波去噪的代码示例:
```python
from PIL import Image, ImageFilter
# 打开带噪声的图像
noisy_image = Image.open('noisy_image.png')
# 应用中值滤波
filtered_image = noisy_image.filter(ImageFilter.MEDIAN_FILTER)
# 保存去噪后的图像
filtered_image.save('denoised_image.png')
```
在该代码段中,我们首先加载了一个带噪声的图像。接着,我们使用`Image.filter`方法和`ImageFilter.MEDIAN_FILTER`参数应用中值滤波器。中值滤波器将每个像素的值替换为其邻域内像素值的中位数,这种方法对于去除图像中的随机噪声非常有效。最终结果被保存为`denoised_image.png`。
## 2.2 机器学习在图像识别中的应用
### 2.2.1 机器学习模型概述
机器学习是人工智能的一个分支,它使计算机系统能够从数据中学习并改进性能。机器学习模型通常分为监督学习、无监督学习、强化学习和半监督学习等。在图像识别任务中,最常使用的是监督学习,其中包括分类器和回归模型。
在监督学习中,训练数据包含输入特征(图像)和相应的输出标签(类别)。模型通过最小化预测误差来学习映射关系。一旦训练完成,模型就可以用来对新的图像进行预测。
以下是使用Scikit-learn库实现简单线性回归模型的示例代码:
```python
from sklearn.linear_model import LinearRegression
from sklearn.metrics import mean_squared_error
import numpy as np
# 创建示例数据
X = np.array([[1], [2], [3], [4], [5]])
y = np.array([1, 2, 3, 4, 5])
# 创建线性回归模型
model = LinearRegression()
# 训练模型
model.fit(X, y)
# 使用模型进行预测
predictions = model.predict(X)
# 计算均方误差
mse = mean_squared_error(y, predictions)
print(f'Mean Squared Error: {mse}')
```
在这个例子中,我们首先导入了`LinearRegression`模型和`mean_squared_error`函数。然后,我们生成了一个简单的线性数据集,并将其转换为NumPy数组。我们创建了`LinearRegression`实例,并使用`.fit()`方法训练了模型。模型训练完成后,我们用训练数据本身进行预测,并计算了预测结果与真实值之间的均方误差,以评估模型性能。
### 2.2.2 训练集与测试集的划分
在机器学习中,数据被分为训练集和测试集,用于训练模型并验证其性能。划分数据集的目的是评估模型在未知数据上的泛化能力。常用的划分比例是80%的训练数据和20%的测试数据,但这一比例可以根据数据集的大小和需要进行调整。
以下是如何在Python中使用Scikit-learn库来划分数据集的示例:
```python
from sklearn.model_selection import train_test_split
import numpy as np
# 假设X是特征矩阵,y是标签向量
X = np.array([...]) # 特征数据
y = np.array([...]) # 对应的标签数据
# 将数据集划分为训练集和测试集
X_train, X_test, y_train, y_test = train_test_split(X, y, test_size=0.2, random_state=42)
# 训练集用于模型训练,测试集用于模型性能评估
```
在这段代码中,我们首先导入了`train_test_split`函数。然后,我们使用该函数对特征矩阵`X`和标签向量`y`进行划分。通过`test_size=0.2`参数,我们指定20%的数据作为测试集。`random_state`参数用于确保每次划分的结果都是一致的,方便结果的复现。
### 2.2.3 模型评估与选择
模型评估是机器学习过程中的关键环节,涉及到选择最佳模型的过程。常见的评估指标包括准确率、召回率、F1分数、ROC曲线和AUC值等。在实践中,模型的选择通常基于交叉验证的分数,这可以减少过拟合的风险,并提供模型泛化能力的更真实估计。
以下是一个使用交叉验证选择最佳模型的例子:
```python
from sklearn.model_selection import cross_val_score
from sklearn.svm import SVC
from sklearn.datasets import load_iris
from sklearn.pipeline import make_pipeline
from sklearn.preprocessing import StandardScaler
# 加载数据集
iris = load_iris()
X, y = iris.data, iris.target
# 创建一个管道,包括预处理(标准化)和分类器(支持向量机)
clf = make_pipeline(StandardScaler(), SVC())
# 使用交叉验证来评估模型性能
scores = cross_val_score(clf, X, y, cv=5)
# 输出交叉验证分数
print(f"Accuracy scores for each fold: {scores}")
print(f"Average accuracy: {scores.mean()}")
```
在这个代码示例中,我们首先加载了鸢尾花数据集。然后,我们创建了一个管道,该管道首先使用`StandardScaler`对数据进行标准化处理,然后使用支持向量机`SVC`作为分类器。我们使用`cross_val_score`函数,通过5折交叉验证来评估模型的性能。最后,我们输出每折的准确率以及平均准确率。
## 2.3 深度学习技术突破
### 2.3.1 卷积神经网络(CNN)原理
卷积神经网络是深度学习领域用于图像识别的重要架构。CNN通过使用卷积层自动从图像中学习空间层次结构。每一层的神经元只与前一层的一个局部区域相连,并提取局部特征。经过多层卷积和池化层后,CNN能够捕捉更高级的特征,从而用于图像分类、目标检测等多种任务。
下面是卷积神经网络的简要架构示意图:
```mermaid
graph LR
A[输入图像] -->|卷积层| B[特征提取]
B -->|池化层| C[特征降维]
C -->|全连接层| D[分类决策]
```
在这个简化的CNN架构中,输入图像首先经过卷积层提取特征,然后通过池化层减少特征的维度,最后通过全连接层输出分类结果。
### 2.3.2 转移学习与预训练模型
转移学习是一种机器学习方法,它允许我们将从一个问题学到的知识应用到另一个相关问题上。在深度学习中,预训练模型是一个在大型数据集上预先训练好的模型,它可以作为起点应用到新的任务中,这可以显著减少所需的数据量和训练时间。
Keras库中的预训练模型例子代码:
```python
from tensorflow.keras.applications import VGG16
from tensorflow.keras.models import Model
from tensorflow.keras.layers import Dense, Flatten
from tensorflow.keras.preprocessing.image import ImageDataGenerator
# 加载预训练的VGG16模型,不包括顶部的全连接层
base_model = VGG16(weights='imagenet', include_top=False)
# 添加新的全连接层作为分类器
x = Flatten()(base_model.output)
x = Dense(256, activa
```

 百万级
高质量VIP文章无限畅学
百万级
高质量VIP文章无限畅学
 千万级
优质资源任意下载
千万级
优质资源任意下载
 C知道
免费提问 ( 生成式Al产品 )
C知道
免费提问 ( 生成式Al产品 )
0
0
相关推荐

专栏简介
本专栏深入探讨图像识别算法的基本原理,重点介绍了图像识别中的核心技术——卷积神经网络(CNN)。通过对 CNN 架构、训练过程和应用的深入分析,读者将全面了解图像识别的关键技术。此外,专栏还揭秘了数据增强技术在图像识别中的重要性,阐述了如何通过数据增强提升模型泛化能力,从而提高图像识别的准确性和鲁棒性。本专栏旨在为读者提供图像识别算法的全面理解,并指导读者在实际应用中有效地使用这些技术。
专栏目录
最低0.47元/天 解锁专栏
买1年送3月
百万级
高质量VIP文章无限畅学
千万级
优质资源任意下载
C知道
免费提问 ( 生成式Al产品 )
最新推荐
【本土化术语详解】:GMW14241中的术语本土化实战指南

# 摘要
术语本土化作为国际交流与合作的关键环节,在确保信息准确传达及提升用户体验中扮演重要角色。本文深入探讨了GMW14241术语本土化的理论与实践,阐述了本土化的目标、原则、语言学考量以及标准化的重要性。文中详述了本土化流程的规划与实施,本土化术语的选取与调整,以及质量控制的标准和措施。案例分析部分对成功本土化的术语进行实例研究,讨论了本土化过程中遇到的挑战及其解决方案,并提出了在实际应用中的反馈与持续改进策略。未
持续集成中文档版本控制黄金法则

# 摘要
随着软件开发流程的日益复杂,持续集成和版本控制成为提升开发效率和产品质量的关键实践。本文首先介绍了持续集成与版本控制的基础知识,探讨了不同版本控制系统的优劣及其配置。随后,文章深入解
Cyclone进阶操作:揭秘高级特性,优化技巧全攻略
# 摘要
Cyclone是一种注重安全性的编程语言,本论文首先概述了Cyclone的高级特性,深入解析了其核心概念,包括类型系统、并发模型和内存管理。接着,提供了实践指南,包括高级函数与闭包、模块化编程和构建部署策略。文章进一步探讨了优化技巧与性能调优,涵盖性能监控、代码级别和系统级别的优化。此外,通过分析实际项目案例,展示了Cyclone在
三菱MR-JE-A伺服电机网络功能解读:实现远程监控与控制的秘诀

# 摘要
本文对三菱MR-JE-A伺服电机的网络功能进行了全面的探讨。首先,介绍了伺服电机的基础知识,然后深入讨论了网络通信协议的基础理论,并详细分析了伺服电机网络功能的框架及其网络安全性。接着,探讨了远程监控的实现方法,包括监控系统架构和用户交互界面的设计。文章还探讨了远程控制的具体方法和实践,包括控制命令
【从图纸到代码的革命】:探索CAD_CAM软件在花键加工中的突破性应用

# 摘要
随着制造业的快速发展,CAD/CAM软件的应用逐渐兴起,成为提高设计与制造效率的关键技术。本文探讨了CAD/CAM软件的基本理论、工作原理和关键技术,并分析了其在花键加工领域的具体应用。通过对CAD/CAM软件工作流程的解析和在花键加工中设计与编程的案例分析,展现了其在提高加工精度和生产效率方面的创新应用。同时,文章展望了CAD/CAM软件未来的发展趋势,重
【S7-200 Smart通信编程秘笈】:通过KEPWARE实现数据交互的极致高效

# 摘要
本文详细探讨了S7-200 Smart PLC与KEPWARE通信协议的应用,包括KEPWARE的基础知识、数据交互、优化通信效率、故障排除、自动化项目中的应用案例以及深度集成与定制化开发。文章深入解析了KEPWARE的架构、工作原理及与PLC的交互模式,并比较了多种工业通信协议,为读者提供了选择指南。同时,介绍了数据映射规则、同步实现、通信效率优化的技巧和故障排除方法。此外,文章还
【CAN2.0网络设计与故障诊断】:打造高效稳定通信环境的必备指南
# 摘要
本文系统地介绍了CAN2.0网络的基础知识、硬件设计、协议深入解析、故障诊断技术、性能优化以及安全防护措施。首先概述了CAN2.0网络的技术基础,接着详细探讨了其硬件组成和设计原则,包括物理层设计、控制器与收发器选择以及网络拓扑结构的构建。文章深入解析了CAN协议的数据封装、时间触发与容错机制,并探讨了其扩展标准。针对网络故障,本文提供了诊断理论、工具使用和案例分析的详细讨论。最后,文章针
VISA函数实战秘籍:测试与测量中的高效应用技巧
# 摘要
VISA(虚拟仪器软件架构)函数库在测试测量领域中扮演着关键角色,它为与各种测试仪器的通信提供了一套标准的接口。本文首先介绍了VISA函数库的基础知识,包括其作用、组成、适用范围以及安装与配置的详细步骤。接着,本文通过编程实践展示了如何利用VISA函数进行数据读写操作和状态控制,同时也强调了错误处理和日志记录的
【完美转换操作教程】:一步步Office文档到PDF的转换技巧

# 摘要
本文旨在提供关于Office文档到PDF格式转换的全面概览,从Office软件内置功能到第三方工具的使用技巧,深入探讨了转换过程中的基础操作、高级技术以及常见问题的解决方法。文章分析了在不同Office应用(Word, Excel, PowerPoint)转换为PDF时的准备工作、操作步骤、格式布局处理和特定内容的兼容性。同时,文中还探讨了第三方软件如
【组态王自动化脚本编写】:提高效率的12个关键脚本技巧
# 摘要
组态王自动化脚本作为一种高效的自动化编程工具,在工业自动化领域中扮演着关键角色。本文首先概述了组态王自动化脚本的基本概念及其在实践中的应用。接着,深入探讨了脚本基础,包括选择合适的脚本语言、脚本组件的使用、以及脚本错误处理方法。本文重点介绍了脚本优化技巧,涵盖代码重构、性能提升、可维护性增强及安全性考虑。通过案例分析,文中展示了组态王脚本在数据处理、设备控制和日志管理等实际应用中的效果。最后,本文展望了组态王脚本的进阶技术及未来发展趋势,提供了一系列先进技术和解决方
资源上传下载、课程学习等过程中有任何疑问或建议,欢迎提出宝贵意见哦~我们会及时处理!
点击此处反馈


专栏目录
最低0.47元/天 解锁专栏
买1年送3月
百万级
高质量VIP文章无限畅学
千万级
优质资源任意下载
C知道
免费提问 ( 生成式Al产品 )