:中点画圆算法在计算机图形学中的应用:圆形抗锯齿与平滑处理,让图形显示更精细
发布时间: 2024-08-28 12:36:11 阅读量: 105 订阅数: 45 

计算机图形学_中点画圆算法
# 1. 中点画圆算法的理论基础**
中点画圆算法是一种经典的计算机图形算法,用于绘制圆形。该算法基于以下数学原理:
- 圆的方程为:(x - h)² + (y - k)² = r²,其中(h, k)为圆心,r为半径。
- 从圆心到圆上任意一点的距离为半径。
中点画圆算法利用这些原理,逐点绘制圆形。算法步骤如下:
1. 确定圆心(h, k)和半径r。
2. 从圆心出发,沿x轴正方向移动一个单位。
3. 计算y坐标,使得点(x, y)满足圆的方程。
4. 将点(x, y)和点(x, -y)绘制到屏幕上,形成圆形的一部分。
5. 重复步骤2-4,直到完成整个圆形。
# 2. 中点画圆算法的实现技巧
### 2.1 算法的步骤和原理
中点画圆算法是一种迭代算法,它通过计算圆上的点逐个绘制圆形。算法的步骤如下:
1. 初始化圆心坐标 (x0, y0) 和半径 r。
2. 计算圆上第一象限的第一个点 (x, y) = (r, 0)。
3. 计算圆上第一象限的下一个点 (x, y) = (x - 1, y + 1)。
4. 计算点 (x, y) 在圆上的对称点 (x, -y)、(-x, y) 和 (-x, -y)。
5. 将这些点绘制到图像上。
6. 重复步骤 3-5,直到绘制完第一象限的圆弧。
7. 对其他三个象限重复步骤 3-6。
### 2.2 算法的优化和改进
为了提高中点画圆算法的效率,可以进行以下优化:
- **对称性优化:**由于圆形具有对称性,因此只需要计算第一象限的点,其他三个象限的点可以通过对称性得到。
- **增量计算:**在计算下一个点时,可以利用前一个点的坐标进行增量计算,避免重复计算。
- **Bresenham 算法:**Bresenham 算法是一种改进的中点画圆算法,它通过计算误差项来确定下一个点的位置,效率更高。
### 2.3 算法的性能分析
中点画圆算法的时间复杂度为 O(r),其中 r 为圆的半径。算法的性能主要受圆的半径影响,半径越大,算法所需的时间越长。
以下代码块展示了中点画圆算法的实现:
```python
import math
def midpoint_circle(x0, y0, r):
"""
中点画圆算法
参数:
x0: 圆心 x 坐标
y0: 圆心 y 坐标
r: 半径
"""
x = r
y = 0
d = 1 - r
while x >= y:
# 绘制对称点
plot(x0 + x, y0 + y)
plot(x0 - x, y0 + y)
plot(x0 + x, y0 - y)
plot(x0 - x, y0 - y)
plot(x0 + y, y0 + x)
plot(x0 - y, y0 + x)
plot(x0 + y, y0 - x)
plot(x0 - y, y0 - x)
if d < 0:
d += 2 * y + 3
else:
d += 2 * (y - x) + 5
y += 1
x -= 1
```
代码逻辑分析:
1. 初始化圆心坐标 (x0, y0) 和半径 r。
2. 计算圆上第一象限的第一个点 (x, y) = (r, 0)。
3. 进入 while 循环,计算圆上第一象限的下一个点。
4. 计算误差项 d,判断是否需要更新 y 坐标。
5. 绘制对称点。
6. 重复步骤 3-5,直到绘制完第一象限的圆弧。
7. 对其他三个象限重复步骤 3-6。
# 3.1 抗锯齿的原理和方法
抗锯齿是一种技术,用于减少图像中锯齿状边缘的出现。锯齿状边缘是由像素化引起的,即图像由离散的像素组成,而不是连续的曲线。当图像中的线条或边缘与像素网格不完全对齐时,就会出现锯齿状边缘。
抗锯齿通过在像素边缘混合颜色来工作。例如,如果一条线穿过一个像素的中心,则该像素将被赋予该线的颜色。但是,如果一条线穿过一个像素的边缘,则该像素将被赋予该线颜色和背景颜色的混合。这会产生一种更平滑的边缘,因为人眼将混合颜色感知为一条连续的线。
有许多不同的抗锯齿方法,包括:
* **超采样抗锯齿 (SSAA)**:这是最简单的抗锯齿方法,它涉

 百万级
高质量VIP文章无限畅学
百万级
高质量VIP文章无限畅学
 千万级
优质资源任意下载
千万级
优质资源任意下载
 C知道
免费提问 ( 生成式Al产品 )
C知道
免费提问 ( 生成式Al产品 )
0
0
相关推荐

专栏简介
本专栏深入探讨了中点画圆算法,揭秘了像素级圆形绘制的奥秘。它提供了分步指南,帮助您掌握绘制技巧。通过深度剖析和优化,该专栏展示了如何提升算法效率,让圆形绘制更流畅。此外,它还比较了中点画圆算法与其他圆形绘制算法,分析了优缺点,帮助您选择最优算法。本专栏还探索了中点画圆算法在图像处理、游戏开发、科学可视化、计算机图形学、嵌入式系统和移动设备上的广泛应用。它提供了实际示例,展示了算法如何解决各种问题,并提供了优化技巧,以在资源受限的情况下实现最佳性能。
专栏目录

文章持续更新中,敬请期待~
最低0.47元/天 解锁专栏
买1年送3月
百万级
高质量VIP文章无限畅学
千万级
优质资源任意下载
C知道
免费提问 ( 生成式Al产品 )
最新推荐
【Java代码审计核心教程】:零基础快速入门与进阶策略
-Concept-in-Java.webp)
# 摘要
Java代码审计是保障软件安全性的重要手段。本文系统性地介绍了Java代码审计的基础概念、实践技巧、实战案例分析、进阶技能提升以及相关工具与资源。文中详细阐述了代码审计的各个阶段,包括准备、执行和报告撰写,并强调了审计工具的选择、环境搭建和结果整理的重要性。结合具体实战案例,文章
【Windows系统网络管理】:IT专家如何有效控制IP地址,3个实用技巧

# 摘要
本文主要探讨了Windows系统网络管理的关键组成部分,特别是IP地址管理的基础知识与高级策略。首先概述了Windows系统网络管理的基本概念,然后深入分析了IP地址的结构、分类、子网划分和地址分配机制。在实用技巧章节中,我们讨论了如何预防和解决IP地址冲突,以及IP地址池的管理方法和网络监控工具的使用。之后,文章转向了高级
【技术演进对比】:智能ODF架与传统ODF架性能大比拼

# 摘要
随着信息技术的快速发展,智能ODF架作为一种新型的光分配架,与传统ODF架相比,展现出诸多优势。本文首先概述了智能ODF架与传统ODF架的基本概念和技术架构,随后对比了两者在性能指标、实际应用案例、成本与效益以及市场趋势等方面的不同。智能ODF架通过集成智能管理系统,提高了数据传输的高效性和系统的可靠性,同时在安全性方面也有显著增强。通过对智能ODF架在不同部署场景中的优势展示和传统ODF架局限性的分析,本文还探讨
化工生产优化策略:工业催化原理的深入分析
# 摘要
本文综述了化工生产优化的关键要素,从工业催化的基本原理到优化策略,再到环境挑战的应对,以及未来发展趋势。首先,介绍了化工生产优化的基本概念和工业催化理论,包括催化剂的设计、选择、活性调控及其在工业应用中的重要性。其次,探讨了生产过程的模拟、流程调整控制、产品质量提升的策略和监控技术。接着,分析了环境法规对化工生产的影响,提出了能源管理和废物处理的环境友好型生产方法。通过案例分析,展示了优化策略在多相催化反应和精细化工产品生产中的实际应用。最后,本文展望了新型催化剂的开发、工业4.0与智能化技术的应用,以及可持续发展的未来方向,为化工生产优化提供了全面的视角和深入的见解。
# 关键字
MIPI D-PHY标准深度解析:掌握规范与应用的终极指南
# 摘要
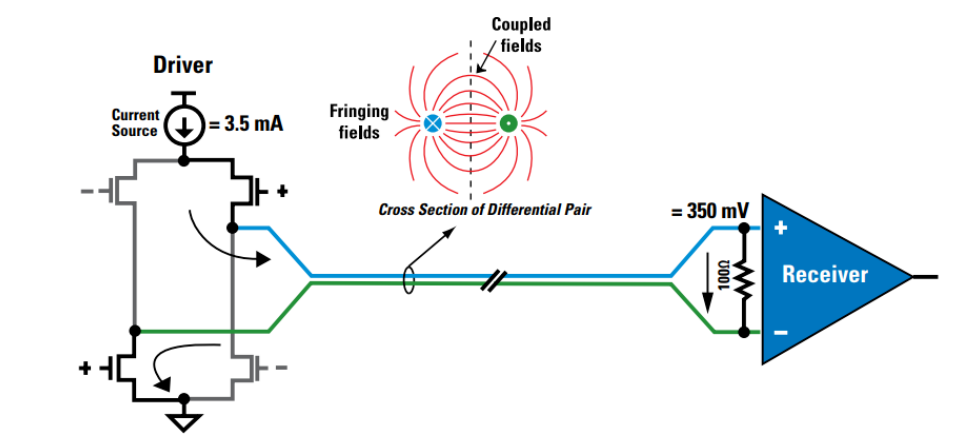
MIPI D-PHY作为一种高速、低功耗的物理层通信接口标准,广泛应用于移动和嵌入式系统。本文首先概述了MIPI D-PHY标准,并深入探讨了其物理层特性和协议基础,包括数据传输的速率、通道配置、差分信号设计以及传输模式和协议规范。接着,文章详细介绍了MIPI D-PHY在嵌入式系统中的硬件集成、软件驱动设计及实际应用案例,同时提出了性能测试与验
【SAP BASIS全面指南】:掌握基础知识与高级技能

# 摘要
SAP BASIS是企业资源规划(ERP)解决方案中重要的技术基础,涵盖了系统安装、配置、监控、备份、性能优化、安全管理以及自动化集成等多个方面。本文对SAP BASIS的基础配置进行了详细介绍,包括系统安装、用户管理、系统监控及备份策略。进一步探讨了高级管理技
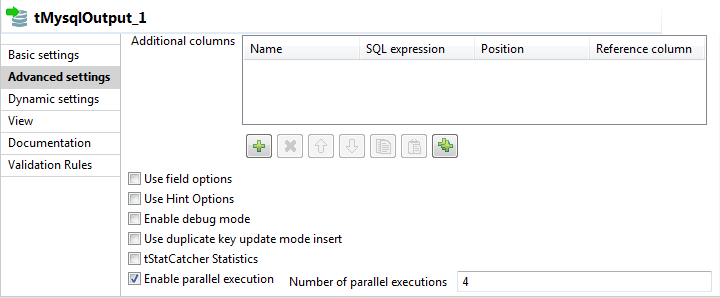
【Talend新手必读】:5大组件深度解析,一步到位掌握数据集成
# 摘要
Talend是一款强大的数据集成工具,本文首先介绍了Talend的基本概念和安装配置方法。随后,详细解读了Talend的基础组件,包括Data Integration、Big Data和Cloud组件,并探讨了各自的核心功能和应用场景。进阶章节分析了Talend在实时数据集成、数据质量和合规性管理以及与其他工
网络安全新策略:Wireshark在抓包实践中的应用技巧

# 摘要
Wireshark作为一款强大的网络协议分析工具,广泛应用于网络安全、故障排除、网络性能优化等多个领域。本文首先介绍了Wireshark的基本概念和基础使用方法,然后深入探讨了其数据包捕获和分析技术,包括数据包结构解析和高级设置优化。文章重点分析了Wireshark在网络安全中的应用,包括网络协议分析、入侵检测与响应、网络取证与合规等。通过实
三角形问题边界测试用例的测试执行与监控:精确控制每一步

# 摘要
本文针对三角形问题的边界测试用例进行了深入研究,旨在提升测试用例的精确性和有效性。文章首先概述了三角形问题边界测试用例的基础理论,包括测试用例设计原则、边界值分析法及其应用和实践技巧。随后,文章详细探讨了三角形问题的定义、分类以及测试用例的创建、管理和执行过程。特别地,文章深入分析了如何控制测试环境与用例的精确性,并探讨了持续集成与边界测试整合的可能性。在测试结果分析与优化方面,本文提出了一系列故障分析方法和测试流程改进策略。最后,文章展望了边界
资源上传下载、课程学习等过程中有任何疑问或建议,欢迎提出宝贵意见哦~我们会及时处理!
点击此处反馈


专栏目录
文章持续更新中,敬请期待~
最低0.47元/天 解锁专栏
买1年送3月
百万级
高质量VIP文章无限畅学
千万级
优质资源任意下载
C知道
免费提问 ( 生成式Al产品 )