
thermal structure (e.g., Cione et al. 2000; Cione and
Uhlhorn 2003), and boundary layer structure (Zhang
et al. 2011a). The advantage of the composite analysis
method is that it helps to fill data voids and provides
a general characterization of the fields under investiga-
tion. The most important drawback to compositing is
that it tends to smooth the data from a large number of
storms that may not be similar. The success of a com-
posite analysis depends on the similarity of the events
studied, thus we initially restrict our analysis to data
collected in hurricanes (V
max
. 33 m s
21
, where V
max
is
the maximum 1-min wind speed), and radially outward
to r* 5 12.5. For each dropwindsonde, V
max
and storm
speed (V
s
) and direction are obtained from the 6-hourly
best-track database (Jarvinen et al. 1984) interpolated to
the time of observation. The frequency distributions of
V
max
, R
max
, and V
s
indicate that observations represent
a broad spectrum of storms (Fig. 3). Storm intensities
range between 33 , V
max
, 77 m s
21
, sizes between 10 ,
R
max
, 72 km, and motion speeds between 0.8 , V
s
,
12.3 m s
21
. The median storm intensity for the whole
sample is V
max
5 56.7 m s
21
(Saffir–Simpson category 3),
radius of maximum wind is R
max
5 31.8 km, and storm
motion speed is V
s
5 5.5 m s
21
.
The inflow angle
1
(a) is defined as the arctangent of
the ratio of radial (y
r
) to tangential (y
t
) wind compo-
nents [a 5 tan
21
(y
r
/y
t
)]. Note that storm-relative inflow
angle (a
SR
) is used exclusively throughout this study.
To calculate the storm-relative inflow angle, the storm
motion vector is removed from the dropwindsonde-
obs erved Cartesian wind vector before transforming to
radial and tangential components relative to the storm
center location. The angle calculation is restricted to the
standard arctangent 6908 half-plane, eliminating the
possibility of anticyclonic flow (y
t
, 0). The frequency
distribution of a
SR
for the initial sample is shown in
Fig. 4a. The distribution is super-Gaussian (normalized
kurtosis k 512.7), which is a primarily a result of nu-
merous outliers exhibiting unrealistically large outflow.
These measurements are mostly found very close to the
estimated storm center, and are likely due to errors in
the wind-determined storm center location, along with
the possibility of multiple wind minima existing (Nolan
and Montgomery 2000). By simply eliminating obser-
vations where r* , 0.5, the frequency distribution of a
SR
becomes more normal (Fig. 4b), suggesting an improved
representation of the expected inflow angle in tropical
cyclones.
Because the accuracy of y
r
and y
t
, and therefore a
SR
,
depend on the storm center position accuracy, the im-
pact of the storm center position error on the computed
inflow angle is briefly examined. WC82 claimed that the
storm center based on flight-level wind observations
can be determined to around 3-km accuracy, although
Kepert (2005) showed that the center position error
within the hurricane boundary layer for a translating
storm can easily be 5 km or more using the WC82
method. The impact of storm center position error on
the uncertainty of inflow angle is simulated by assuming
the storm center position is in error (one standard de-
viation, s) by 5 km, and a normal distribution of inflow
angles is generated by Monte Carlo simulation of 1000
realizations. Figure 5 shows the simulated inflow angle
error (normalized by the sample s 5 18.38 as indicated
in Fig. 4b) versus r*, where the sample median (mini-
mum) R
max
of 32 (10) km is used to normalize the radial
distance. For comparison, a 2-km center position error-
induced inflow angle error is shown, representing the
estimated accuracy of the translating pressure center
tracking method proposed by Kepert ( 2005). Except
for the smallest storms, a 5-km center position error
induces an inflow angle error smaller than 18.38 outside
of r* 5 1, and would likely be buried in the natural
surface wind variability. Some improvement to the
accuracy could be made by utilizing the pressure-based
method, especially close to the center in small storms,
but it appears that the vast majority of data would not
be strongly impacted by the error in storm center
specification.
Although data are included all the way into the esti-
mated center, inflow angles 62s away from the sample
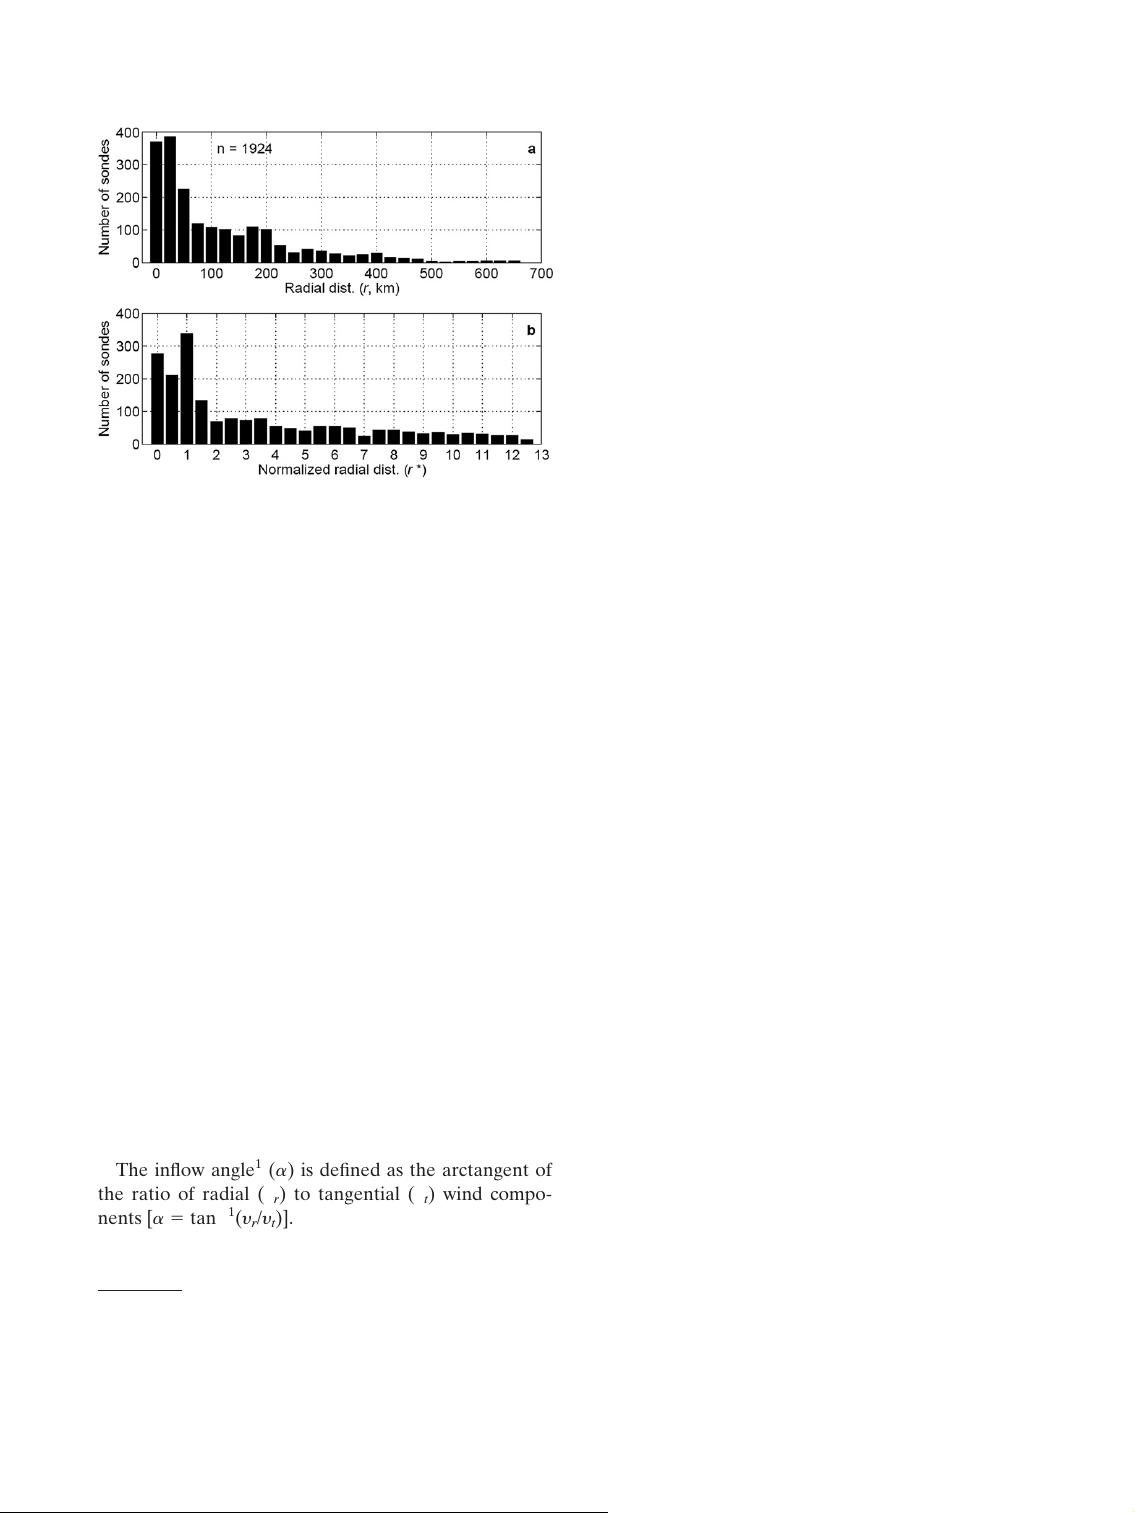
FIG. 2. Radial distribution of dropwindsonde counts per bin as
a function of (a) real distance and (b) normalized distance. Counts
are per bin widths of (a) 20 km and (b) 0.5r*.
1
Inflow is defined as y
r
, 0, although we still refer to ‘‘inflow
angle’’ when outflow (y
r
. 0) occurs. Also, a ‘‘larger inflow angle’’
or the like will generally indicate a more negative value throughout
this article.
3590 MONTHLY WEATHER REVIEW VOLUME 140
流入角的定义
剩余18页未读,继续阅读

iecas_wang
- 粉丝: 0
- 资源: 1
 我的内容管理
展开
我的内容管理
展开


最新资源
- 贵州煤矿矿井水分类与处理策略:悬浮物、酸性与非酸性
- 醛固酮增多症肾上腺静脉采样对比:ACTH后LR-CAV的最优评估
- 开源云连接传感器监控平台:农业土壤湿度远程监测
- 母婴用品企业年度生产计划线性规划优化模型:实证与应用
- 井下智能变电站:Rogowski线圈电流检测系统的研发与性能验证
- 霍州矿区煤巷稳定性分析及支护策略
- ARM嵌入式系统远程软件更新方案:基于TFTP协议
- 煤炭选煤中汞分布规律与洗选脱汞效果
- 提升码垛机器人性能:拉格朗日动力学模型与滑模模糊控制的应用
- 增强现实技术提升学前手写教学:设计与开发案例
- 不规则工作面沉陷三角剖分算法提升与应用
- 卡尔曼滤波在瞬变电磁干扰压制中的应用研究
- 煤矿安全能力研究:理论与系统构建
- LonWorks总线技术在斜巷运输车辆定位与跑车防护中的应用
- 神东煤炭集团高效煤粉锅炉系统:节能环保新实践
- Ti/SnO2+Sb2Ox/PbO2电极分形维数与电催化性能研究
资源上传下载、课程学习等过程中有任何疑问或建议,欢迎提出宝贵意见哦~我们会及时处理!
点击此处反馈


