
多条曲线之曲线说明多条曲线之曲线说明
import matplotlib.pyplot as plt
import numpy as np
# 从[-1,1]中等距去50个数作为x的取值
x = np.linspace(-1, 1, 50)
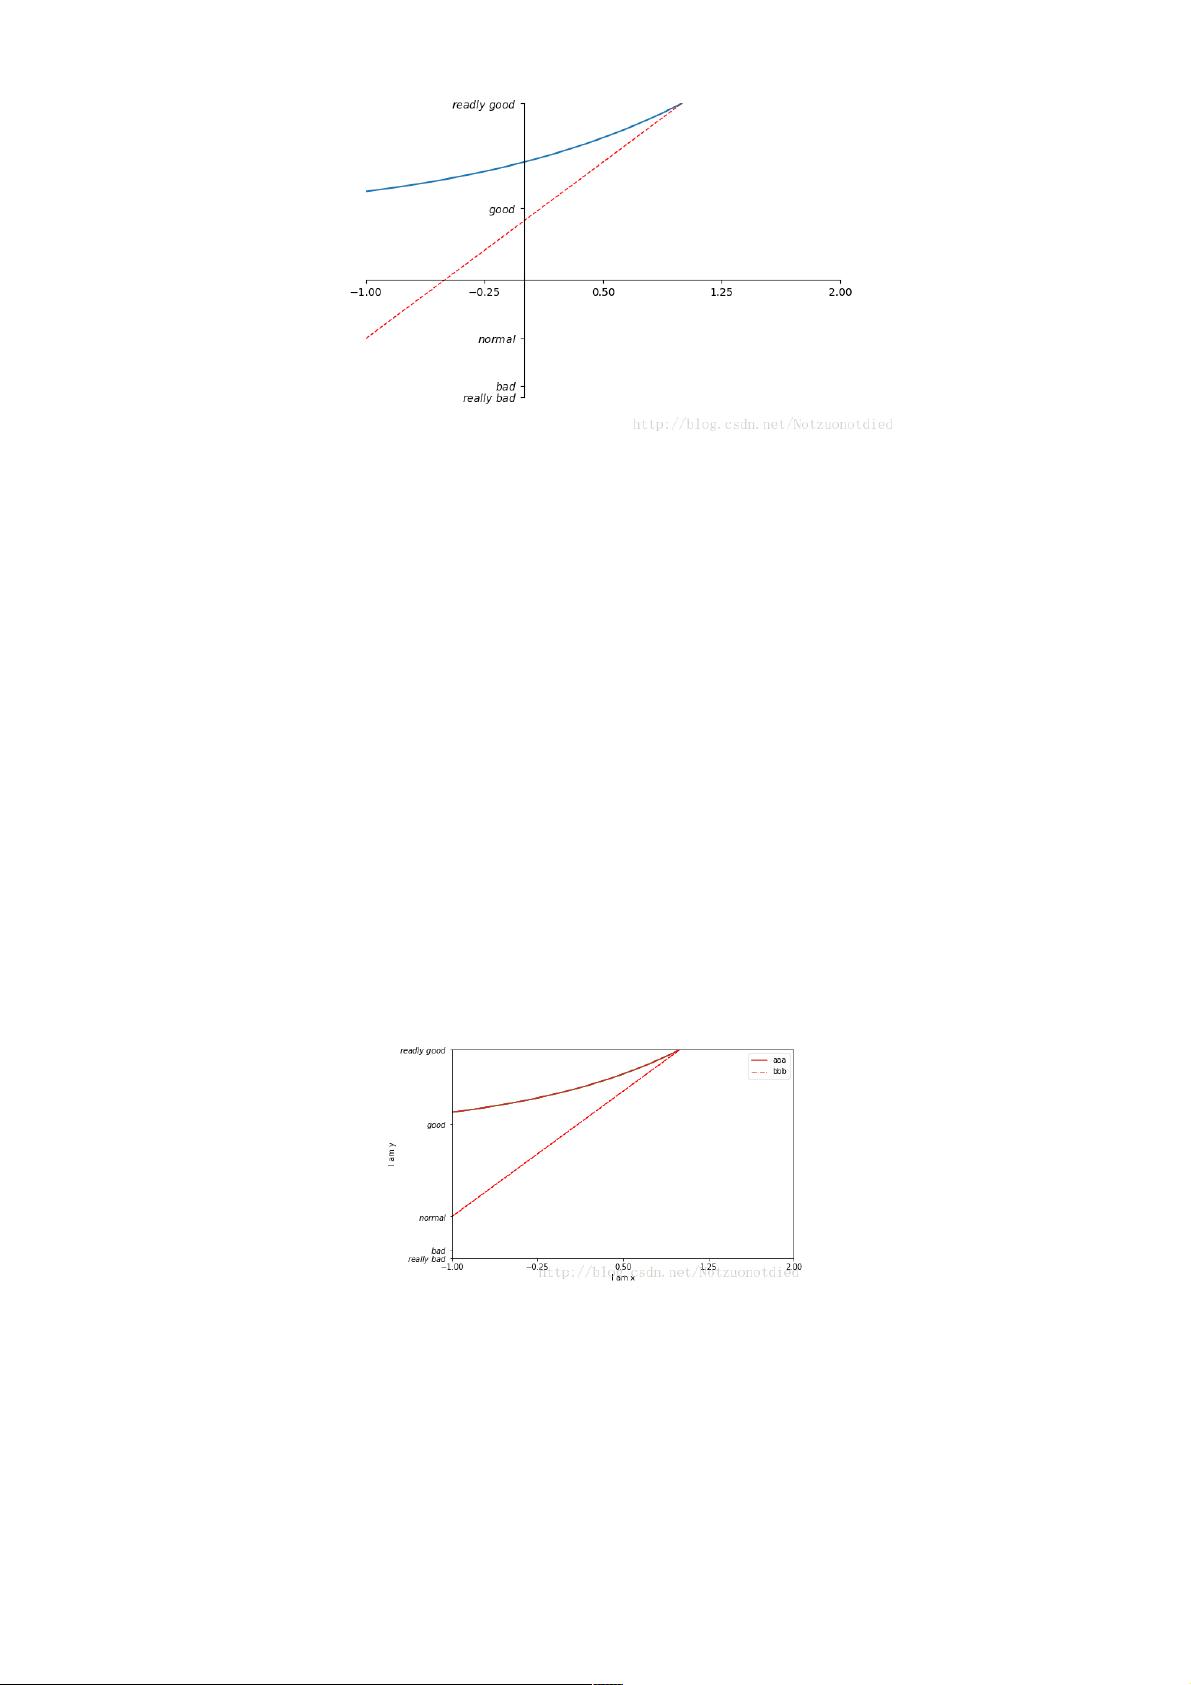
y1 = 2*x + 1
y2 = 2**x + 1
# 第一个参数表示的是编号,第二个表示的是图表的长宽
plt.figure(num = 3, figsize=(8, 5))
plt.plot(x, y2)
plt.plot(x, y1, color='red', linewidth=1.0, linestyle='--')
# 设置取值参数
plt.xlim((-1, 2))
plt.ylim((1, 3))
# 设置lable
plt.xlabel("I am x")
plt.ylabel("I am y")
# 设置点的位置
new_ticks = np.linspace(-1, 2, 5)
plt.xticks(new_ticks)
plt.yticks([-2, -1.8, -1, 1.22,3],
[r'$really\ bad$', r'$bad$', r'$normal$', r'$good$', r'$readly\ good$'])
l1, = plt.plot(x, y2,
label='aaa'
)
l2, = plt.plot(x, y1,
color='red', # 线条颜色
linewidth = 1.0, # 线条宽度
linestyle='-.', # 线条样式
label='bbb' #标签
)
# 使用legend绘制多条曲线
plt.legend(handles=[l1, l2],
labels = ['aaa', 'bbb'],
loc = 'best'
)
plt.show()
多个多个figure,并加上特殊点注释,并加上特殊点注释
import matplotlib.pyplot as plt
import numpy as np
# 从[-1,1]中等距去50个数作为x的取值
x = np.linspace(-1, 1, 50)
y1 = 2*x + 1
y2 = 2**x + 1
plt.figure(figsize=(12, 8)) # 第一个参数表示的是编号,第二个表示的是图表的长宽
plt.plot(x, y2)
plt.plot(x, y1, color='red', linewidth=1.0, linestyle='--')
# gca = 'get current axis'
ax = plt.gca()
# 将右边和上边的边框(脊)的颜色去掉
ax.spines['right'].set_color('none')
ax.spines['top'].set_color('none')
# 绑定x轴和y轴
ax.xaxis.set_ticks_position('bottom')
ax.yaxis.set_ticks_position('left')
# 定义x轴和y轴的位置
ax.spines['bottom'].set_position(('data', 0))
ax.spines['left'].set_position(('data', 0))
剩余10页未读,继续阅读

weixin_38673235
- 粉丝: 3
- 资源: 912
 我的内容管理
收起
我的内容管理
收起
- 我的资源
快来上传第一个资源
 我的收益 登录查看自己的收益
 我的积分
登录查看自己的积分
我的积分
登录查看自己的积分
 我的C币
登录后查看C币余额
我的C币
登录后查看C币余额
 我的收藏
我的收藏  我的下载
我的下载  下载帮助
下载帮助

会员权益专享


最新资源
- 京瓷TASKalfa系列维修手册:安全与操作指南
- 小波变换在视频压缩中的应用
- Microsoft OfficeXP详解:WordXP、ExcelXP和PowerPointXP
- 雀巢在线媒介投放策划:门户网站与广告效果分析
- 用友NC-V56供应链功能升级详解(84页)
- 计算机病毒与防御策略探索
- 企业网NAT技术实践:2022年部署互联网出口策略
- 软件测试面试必备:概念、原则与常见问题解析
- 2022年Windows IIS服务器内外网配置详解与Serv-U FTP服务器安装
- 中国联通:企业级ICT转型与创新实践
- C#图形图像编程深入解析:GDI+与多媒体应用
- Xilinx AXI Interconnect v2.1用户指南
- DIY编程电缆全攻略:接口类型与自制指南
- 电脑维护与硬盘数据恢复指南
- 计算机网络技术专业剖析:人才培养与改革
- 量化多因子指数增强策略:微观视角的实证分析
资源上传下载、课程学习等过程中有任何疑问或建议,欢迎提出宝贵意见哦~我们会及时处理!
点击此处反馈


