
The above screenshot shows the other half of the journey for the data - from the wget program's userspace buffers to disk. To get the buffers to disk, the wget program issues a
write(2), which does a copy-from-user to the kernel, which then takes care via some circuitous path (probably also present somewhere in the profile data), to get it safely to disk.
Now that we've seen the basic layout of the profile data and the basics of how to extract useful information out of it, let's get back to the task at hand and see if we can get
some basic idea about where the time is spent in the program we're profiling, wget. Remember that wget is actually implemented as an applet in busybox, so while the process
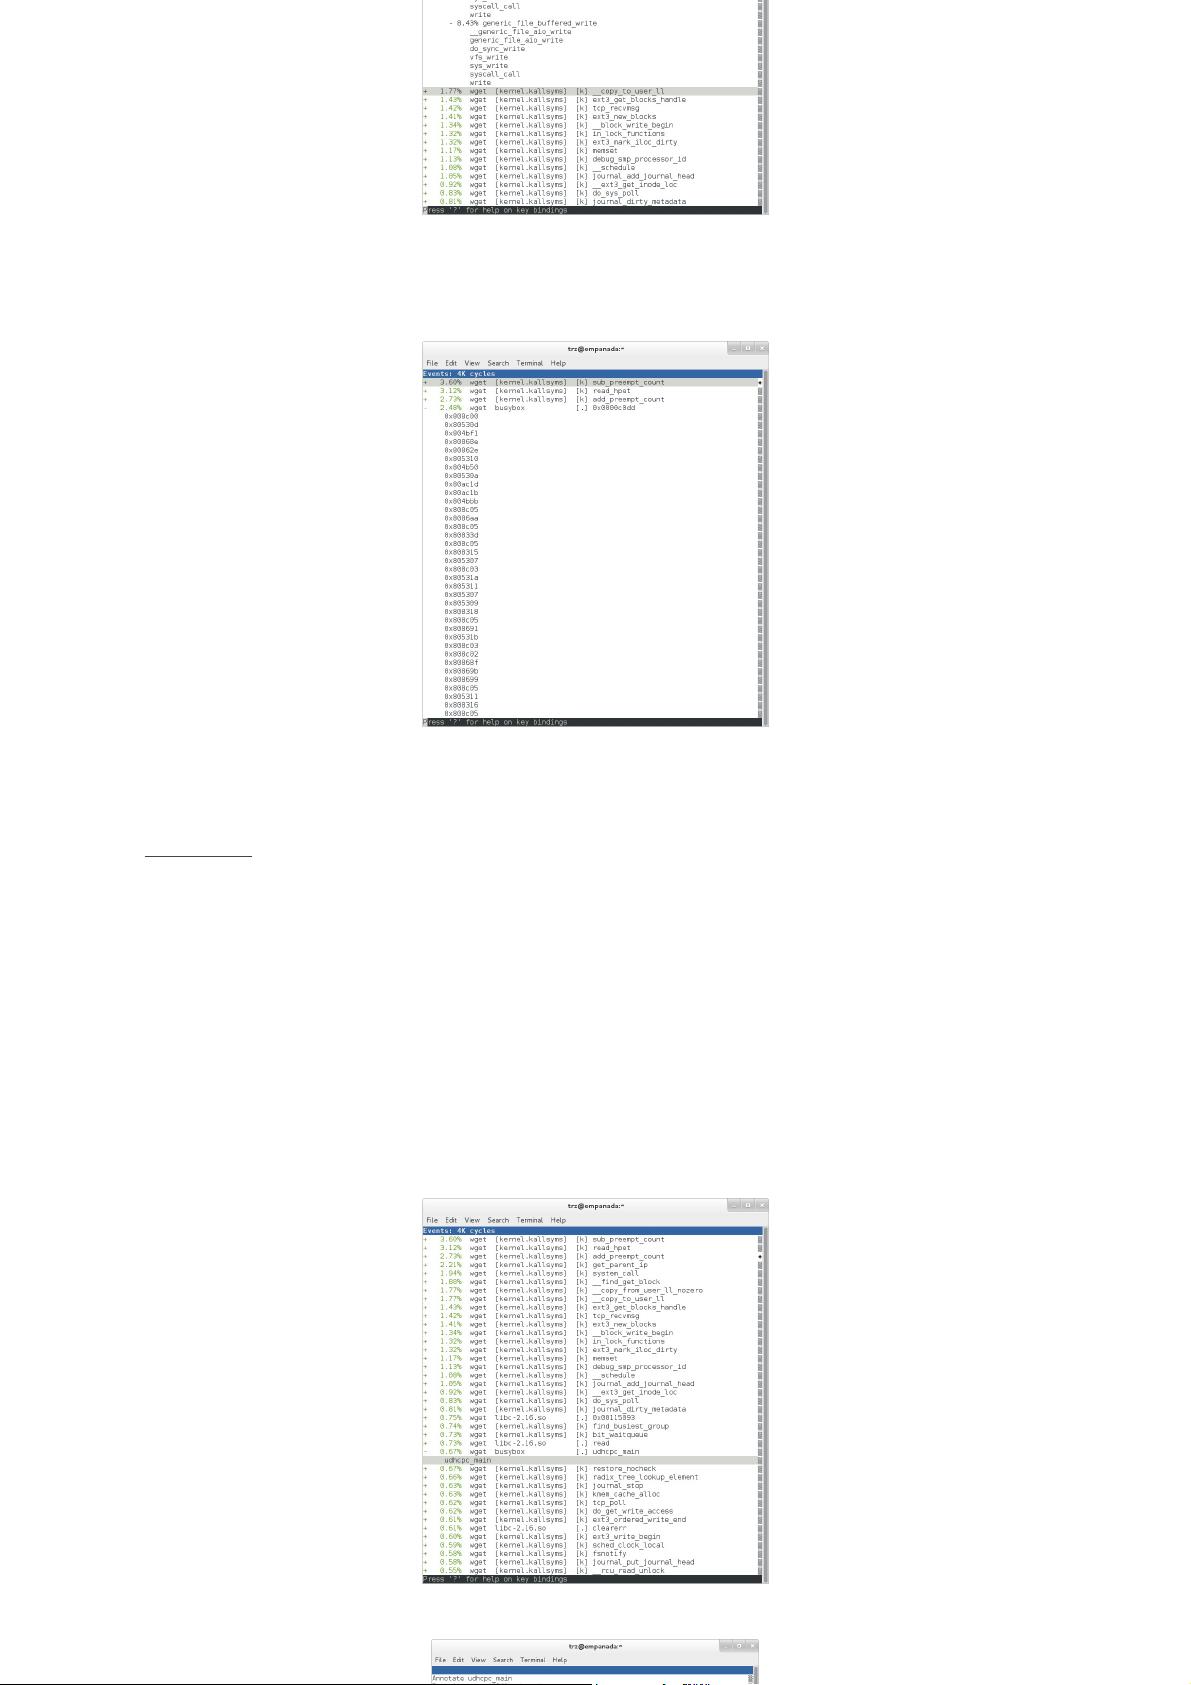
name is 'wget', the executable we're actually interested in is busybox. So let's expand the first entry containing busybox:
Again, before we expanded we saw that the function was labeled with a hex value instead of a symbol as with most of the kernel entries. Expanding the busybox entry doesn't
make it any better.
The problem is that perf can't find the symbol information for the busybox binary, which is actually stripped out by the Yocto build system.
One way around that is to put the following in your local.conf file when you build the image:
INHIBIT_PACKAGE_STRIP = "1"
However, we already have an image with the binaries stripped, so what can we do to get perf to resolve the symbols? Basically we need to install the debuginfo for the busybox
package.
To generate the debug info for the packages in the image, we can add dbg-pkgs to EXTRA_IMAGE_FEATURES in local.conf. For example:
EXTRA_IMAGE_FEATURES = "debug-tweaks tools-profile dbg-pkgs"
Additionally, in order to generate the type of debuginfo that perf understands, we also need to add the following to local.conf:
PACKAGE_DEBUG_SPLIT_STYLE = 'debug-file-directory'
Once we've done that, we can install the debuginfo for busybox. The debug packages once built can be found in build/tmp/deploy/rpm/* on the host system. Find the busybox-
dbg-...rpm file and copy it to the target. For example:
[trz@empanada core2]$ scp /home/trz/yocto/crownbay-tracing-dbg/build/tmp/deploy/rpm/core2_32/busybox-dbg-1.20.2-r2.core2_32.rpm root@192.168.1.31:
root@192.168.1.31's password:
busybox-dbg-1.20.2-r2.core2_32.rpm 100% 1826KB 1.8MB/s 00:01
Now install the debug rpm on the target:
root@crownbay:~# rpm -i busybox-dbg-1.20.2-r2.core2_32.rpm
Now that the debuginfo is installed, we see that the busybox entries now display their functions symbolically:
If we expand one of the entries and press 'enter' on a leaf node, we're presented with a menu of actions we can take to get more information related to that entry:
剩余22页未读,继续阅读

Rolylee
- 粉丝: 2
- 资源: 5
 我的内容管理
展开
我的内容管理
展开


最新资源
- 新型矿用本安直流稳压电源设计:双重保护电路
- 煤矿掘进工作面安全因素研究:结构方程模型
- 利用同位素位移探测原子内部新型力
- 钻锚机钻臂动力学仿真分析与优化
- 钻孔成像技术在巷道松动圈检测与支护设计中的应用
- 极化与非极化ep碰撞中J/ψ的Sivers与cos2φ效应:理论分析与COMPASS验证
- 新疆矿区1200m深孔钻探关键技术与实践
- 建筑行业事故预防:综合动态事故致因理论的应用
- 北斗卫星监测系统在电网塔形实时监控中的应用
- 煤层气羽状水平井数值模拟:交替隐式算法的应用
- 开放字符串T对偶与双空间坐标变换
- 煤矿瓦斯抽采半径测定新方法——瓦斯储量法
- 大倾角大采高工作面设备稳定与安全控制关键技术
- 超标违规背景下的热波动影响分析
- 中国煤矿选煤设计进展与挑战:历史、现状与未来发展
- 反演技术与RBF神经网络在移动机器人控制中的应用
资源上传下载、课程学习等过程中有任何疑问或建议,欢迎提出宝贵意见哦~我们会及时处理!
点击此处反馈


