

4I.Oguzetal.
new task. In medical image segmentation, the Dice [6] and Jaccard [11] overlap
ratios are the most popular evaluation measures [16,22]. The mean and maxi-
mum surface distances between 3D objects are also commonly used to evaluate
segmentation algorithms [9], as are distances between segmentation results and
manual landmarks. However, such measures are based on the implicit assump-
tion that the number of segmentation targets is known a priori, e.g., whether it
is one liver, two hippocampi, or five lung lobes. This is in contrast to a differ-
ent but equally important class of segmentation tasks, such as the segmentation
of white matter lesions or lung nodules, where the number of target objects
can vary from zero to hundreds or more. In these scenarios, the object detection
and segmentation tasks become intertwined and as such, performance evaluation
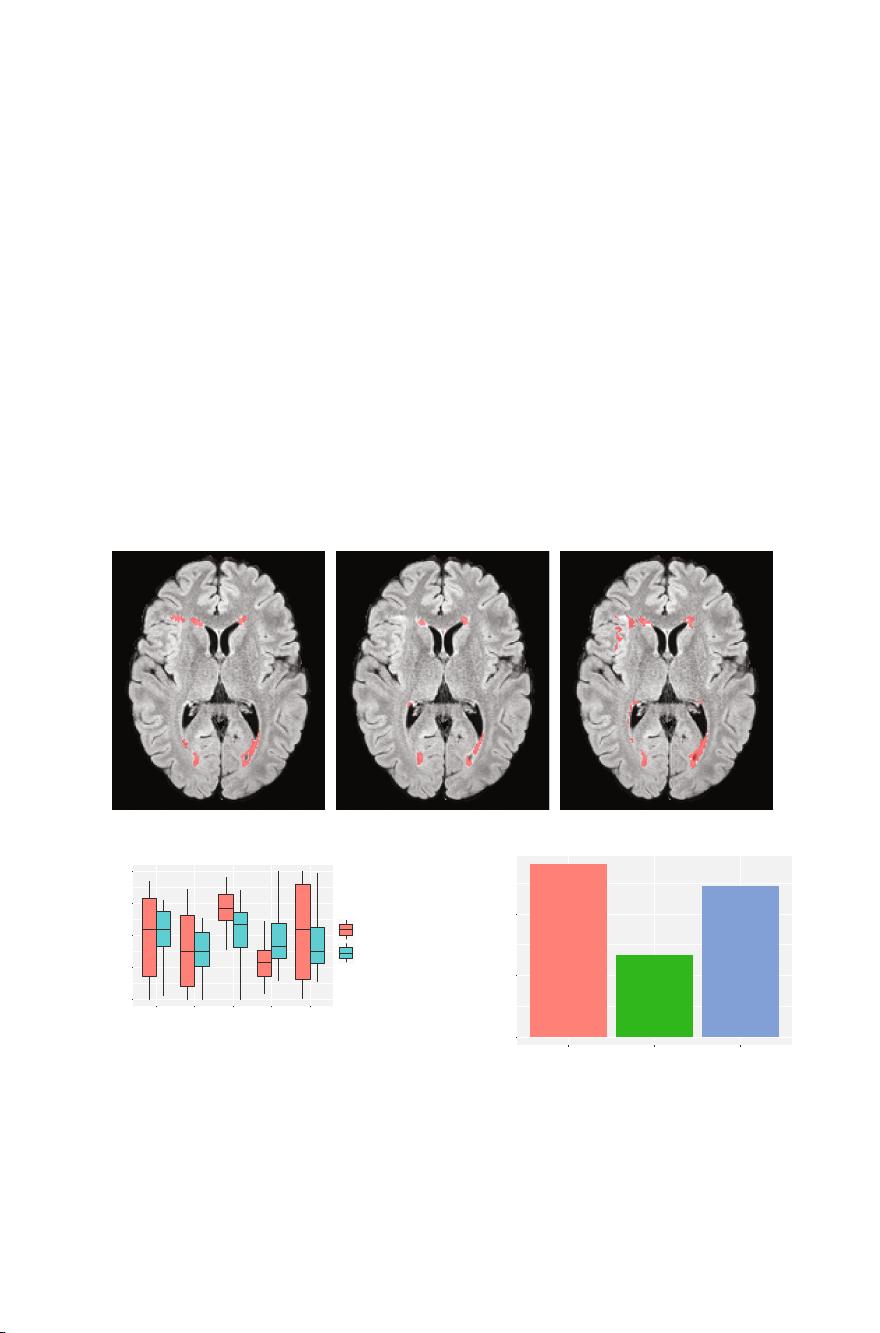
needs to take both aspects into consideration. Although, it has been customary
to use the image-wide Dice overlap in these combined detection and segmen-
tation problems, this is an oversimplification and can often hide differences in
algorithm behaviors (e.g., Fig. 1). Another popular criterion in these types of
applications is the number of segmented objects, which attempts to evaluate the
detection success. However, the object count alone is an ambiguous metric as it
reflects not only the false positive and false negative detections but also larger
objects that may be erroneously split into multiple smaller ones, or multiple
small objects erroneously merged into a single, larger object. Furthermore, these
commonly used metrics fail to relate the size of the object to the final score,
which can be important: for many applications, an algorithm that misses large
objects is considered less clinically relevant than an algorithm that misses small
objects.
A prime example of an application domain with a variable number of objects
is multiple sclerosis (MS) lesion segmentation from MRI scans of the brain. White
matter lesions are the hallmark of MS and their segmentation and quantifica-
tion are critical for clinical purposes. Many approaches to MS lesion segmen-
tation have been proposed: artificial [10] and convolutional neural networks [1];
Bayesian models [7]; Gaussian mixture models [23]; graph cuts [8]; and ran-
dom forests [12]. This field of research remains very active and several grand
challenges (MICCAI 2008 [19], ISBI 2015 [2], MICCAI 2016 [13]) have been
organized in recent years. The evaluation of new algorithms often relies on Dice
and Jaccard overlaps and lesion counts, which limits our ability to fully assess
other characteristics in performance difference.
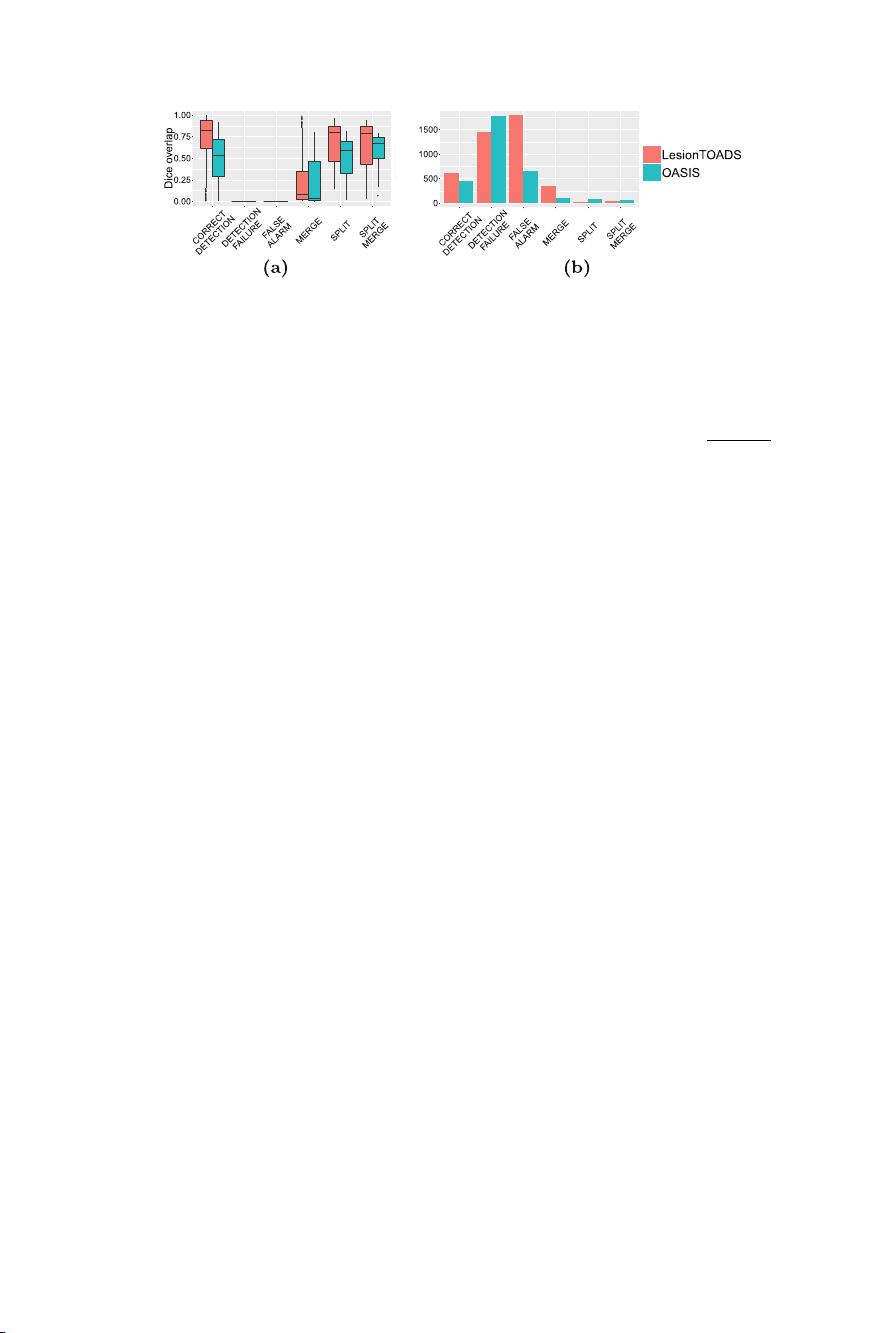
We propose a new set of evaluation techniques to compare segmentations
with a variable number of target objects, including a classification of segmenta-
tion results and statistics at object and category levels. We illustrate these tech-
niques in an MS lesion segmentation study comparing two algorithms: Lesion-
TOADS [17] which is an unsupervised clustering algorithm with topological con-
straints; and OASIS [21] is a supervised classifier based on multi-modal logistic
regression.


剩余523页未读,继续阅读

wang1062807258
- 粉丝: 13
- 资源: 272
 我的内容管理
展开
我的内容管理
展开


最新资源
- Lombok 快速入门与注解详解
- SpringSecurity实战:声明式安全控制框架解析
- XML基础教程:从数据传输到存储解析
- Matlab实现图像空间平移与镜像变换示例
- Python流程控制与运算符详解
- Python基础:类型转换与循环语句
- 辰科CD-6024-4控制器说明书:LED亮度调节与触发功能解析
- AE particular插件全面解析:英汉对照与关键参数
- Shell脚本实践:创建tar包、字符串累加与简易运算器
- TMS320F28335:浮点处理器与ADC详解
- 互联网基础与结构解析:从ARPANET到多层次ISP
- Redhat系统中构建与Windows共享的Samba服务器实战
- microPython编程指南:从入门到实践
- 数据结构实验:顺序构建并遍历链表
- NVIDIA TX2系统安装与恢复指南
- C语言实现贪吃蛇游戏基础代码
资源上传下载、课程学习等过程中有任何疑问或建议,欢迎提出宝贵意见哦~我们会及时处理!
点击此处反馈


