服务器相关实用Linux主题深度解析
需积分: 6 152 浏览量
更新于2024-07-18
收藏 3.47MB PDF 举报
"《实用Linux主题》(Practical Linux Topics)是由Chris Binnie编著的一本深入探讨Linux领域的专业书籍。该书定位为实用指南,适合那些希望学习并长期参考服务器相关技术的读者。作者以其在Linux领域的专家身份,提供了全面而详实的内容,涵盖了广泛的Linux主题,确保读者能够掌握实践中的关键技能。
书中不仅包含了基础概念的阐述,还深入到诸如云计算、服务器管理、网络配置、安全实践、性能优化等高级主题。通过阅读本书,读者可以了解到如何在实际环境中有效地运用Linux,无论是企业级应用还是个人开发项目,都能从中受益。每一章节都经过精心设计,以便读者能够在理论与实践之间建立牢固的联系。
版权方面,所有内容受到保护,未经Springer出版社许可,不得擅自复制或传播,包括但不限于翻译、再版、复用插图、朗读、广播、微缩胶片复制、电子适应性转换或任何形式的信息存储和检索。只有在符合版权法和出版商所在地当前版本的规定下,且专为购买者计算机系统上的个人使用而准备的学术评论或学术分析材料才可例外。
《实用Linux主题》是一本不可多得的参考资料,对于想要提升Linux技能的读者来说,无论是初学者还是经验丰富的专业人士,都将从中获得宝贵的知识和实战经验。通过这本书,读者不仅可以掌握Linux的基础操作,还能了解如何将其应用于现代IT环境中的云服务,从而提高工作效率和业务效能。"

1
Chapter 1
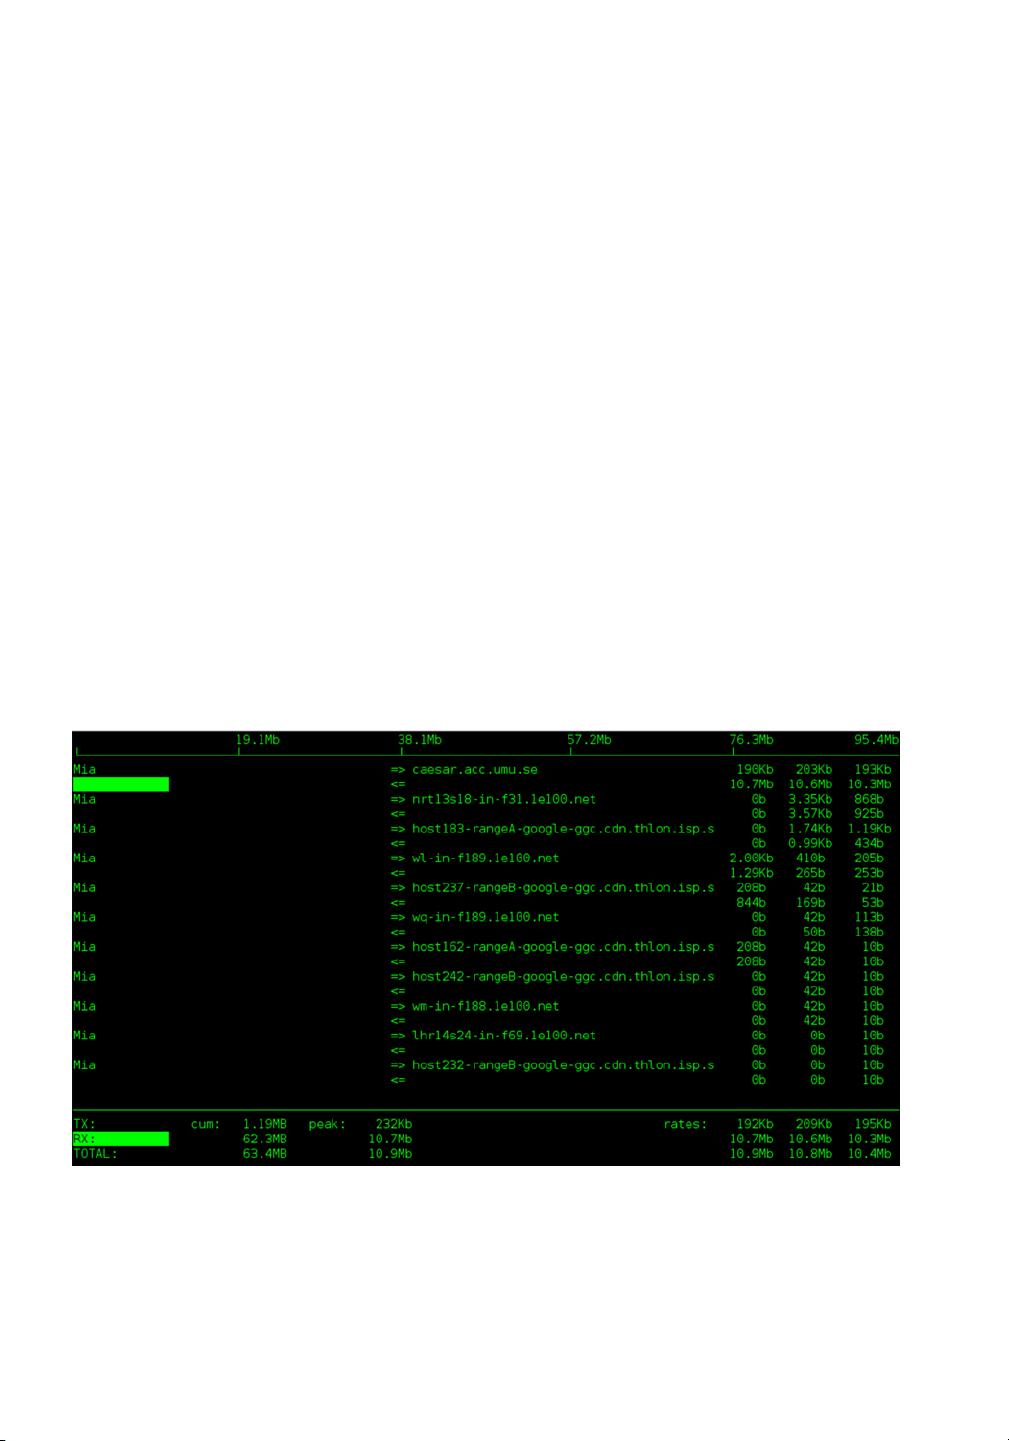
Real Time Network Statistics
with Iftop
Monitoring network connections certainly can be frustrating, mainly because they can be established and
then disappear within a matter of seconds. In this chapter, I show you how to achieve a Zen like approach
to monitoring network connections on your servers using a command line–based tool called iftop. I then
finish by walking through the creation of a configuration file that you can use again on different servers once
you have your monitoring set up as you prefer.
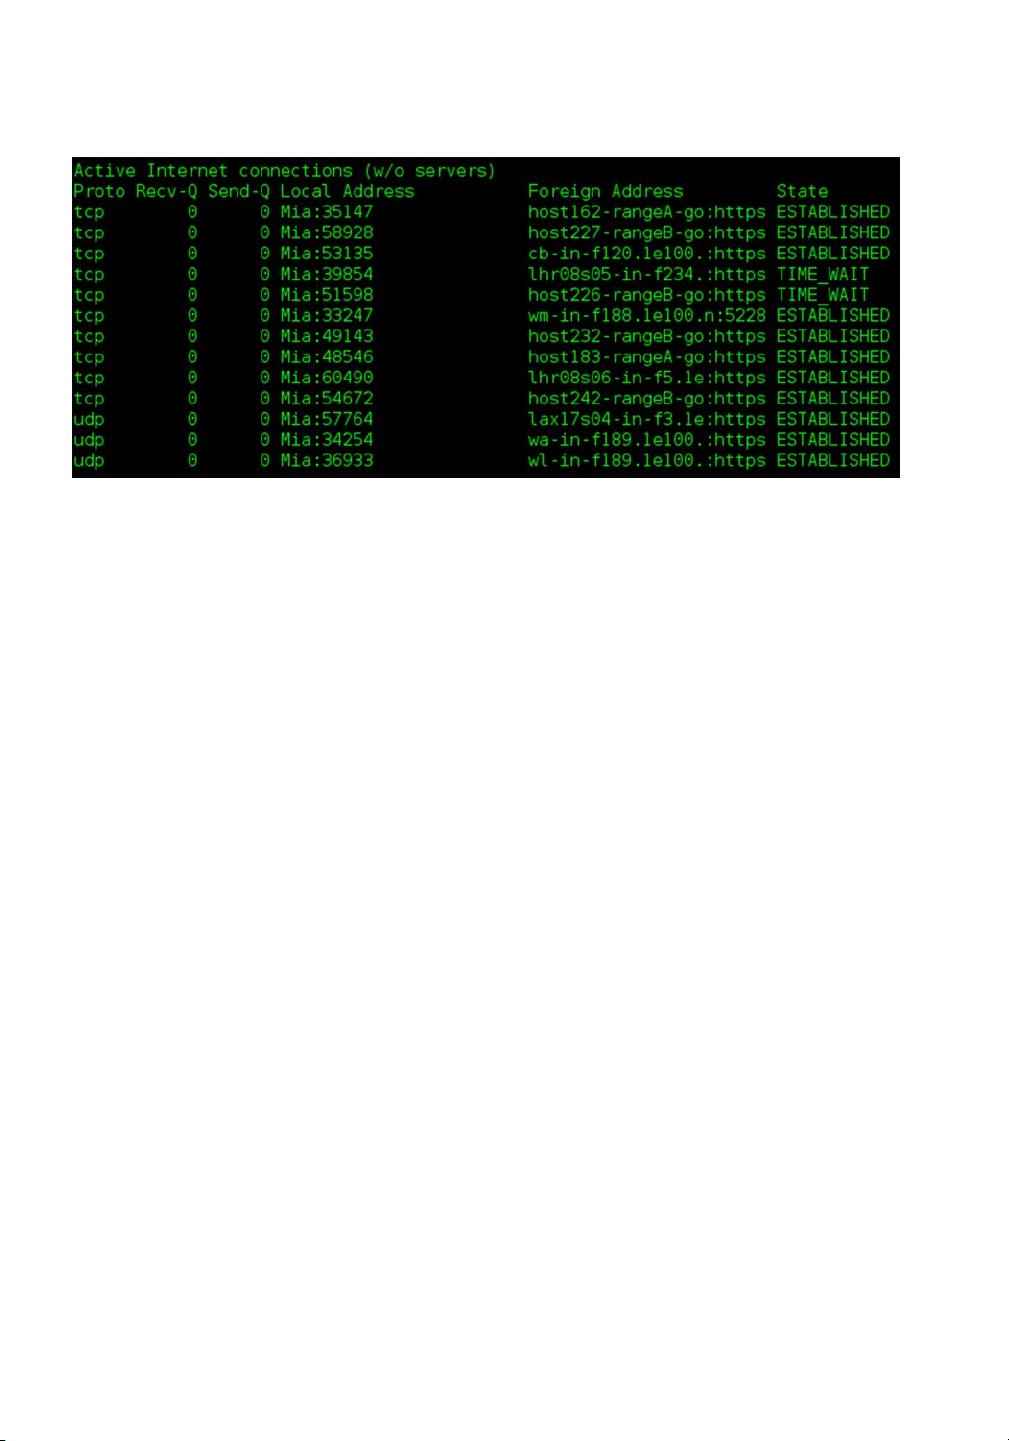
Monitoring Network Connections with netstat
The netstat command-line tool has been a staple among system admins. Although rich in features,
including an auto-refresh parameter (continuous mode), netstat is certainly not designed to do much
more than output raw numbers and names (from hosts and ports). To run netstat in continuous mode, for
example, you can use:
# netstat c
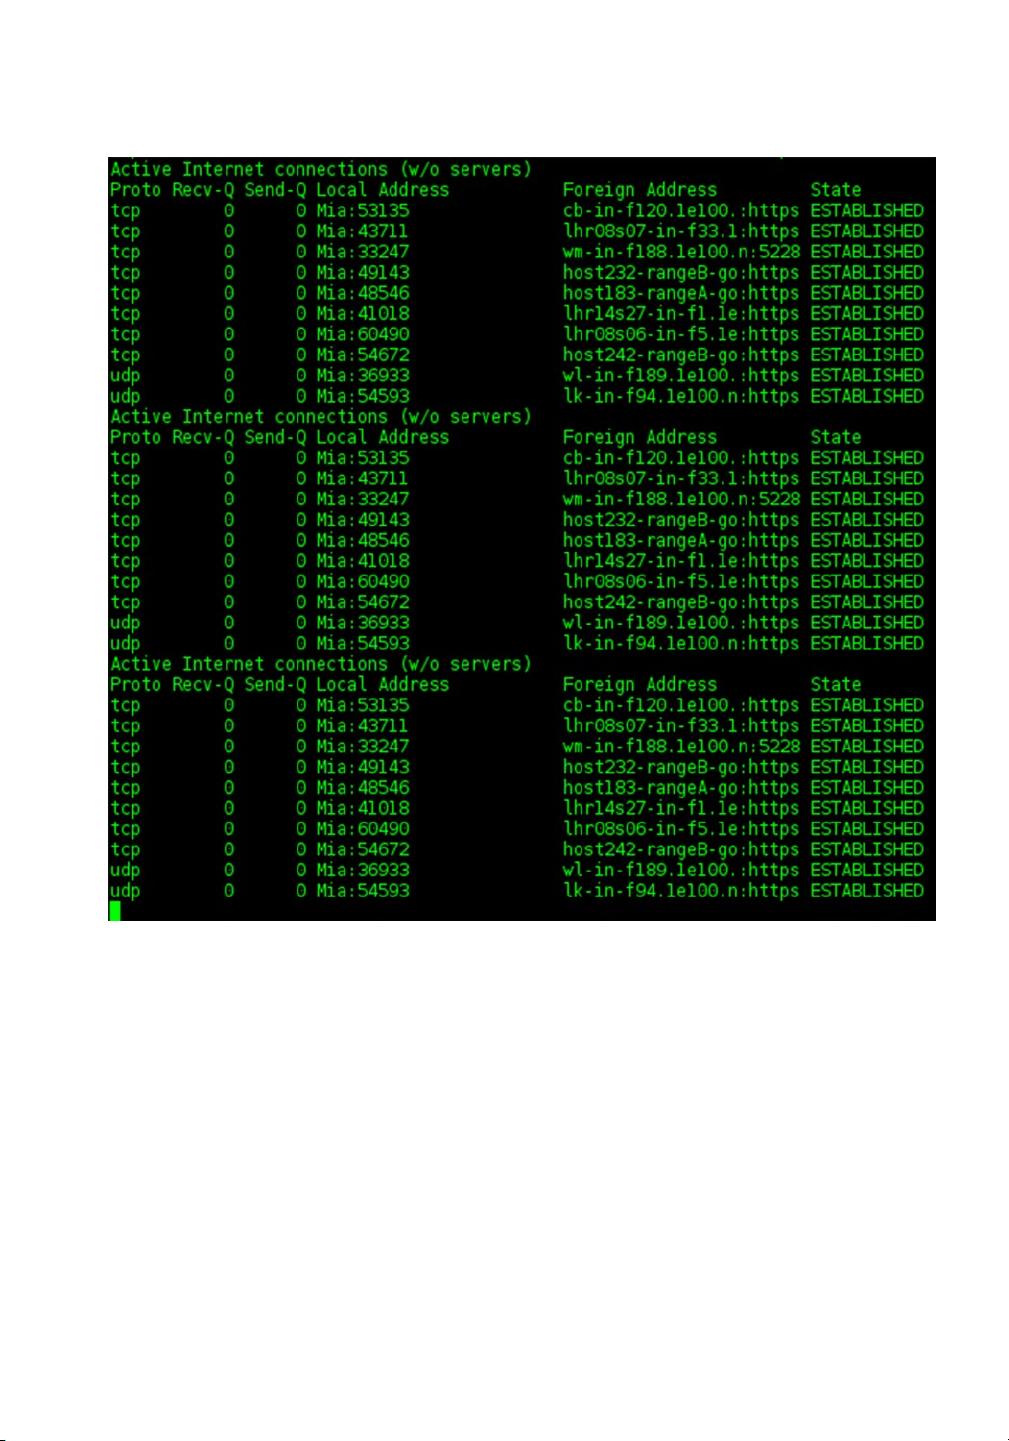
I usually end up running it alongside watch to give me the kind of clean screen refreshes I need for
different scenarios; for example:
# watch n2 "netstat tu"
In this example, watch lets me configure a two-second gap prior to running the command again and
updating its output (see Figure1-1).

剩余155页未读,继续阅读
2019-01-11 上传
2017-09-27 上传
2023-10-22 上传
2023-06-23 上传
2023-08-31 上传
2023-04-01 上传
2023-07-27 上传
2023-08-26 上传
2024-01-03 上传

skinap
- 粉丝: 0
- 资源: 6
 我的内容管理
展开
我的内容管理
展开


最新资源
- AirKiss技术详解:无线传递信息与智能家居连接
- Hibernate主键生成策略详解
- 操作系统实验:位示图法管理磁盘空闲空间
- JSON详解:数据交换的主流格式
- Win7安装Ubuntu双系统详细指南
- FPGA内部结构与工作原理探索
- 信用评分模型解析:WOE、IV与ROC
- 使用LVS+Keepalived构建高可用负载均衡集群
- 微信小程序驱动餐饮与服装业创新转型:便捷管理与低成本优势
- 机器学习入门指南:从基础到进阶
- 解决Win7 IIS配置错误500.22与0x80070032
- SQL-DFS:优化HDFS小文件存储的解决方案
- Hadoop、Hbase、Spark环境部署与主机配置详解
- Kisso:加密会话Cookie实现的单点登录SSO
- OpenCV读取与拼接多幅图像教程
- QT实战:轻松生成与解析JSON数据
