
50 100 150 200 250
Frequency (Hz)
Magnitude
A B C D
(a)
0 50 100
Time (ms)
Normalized EMF
A B C D
(b)
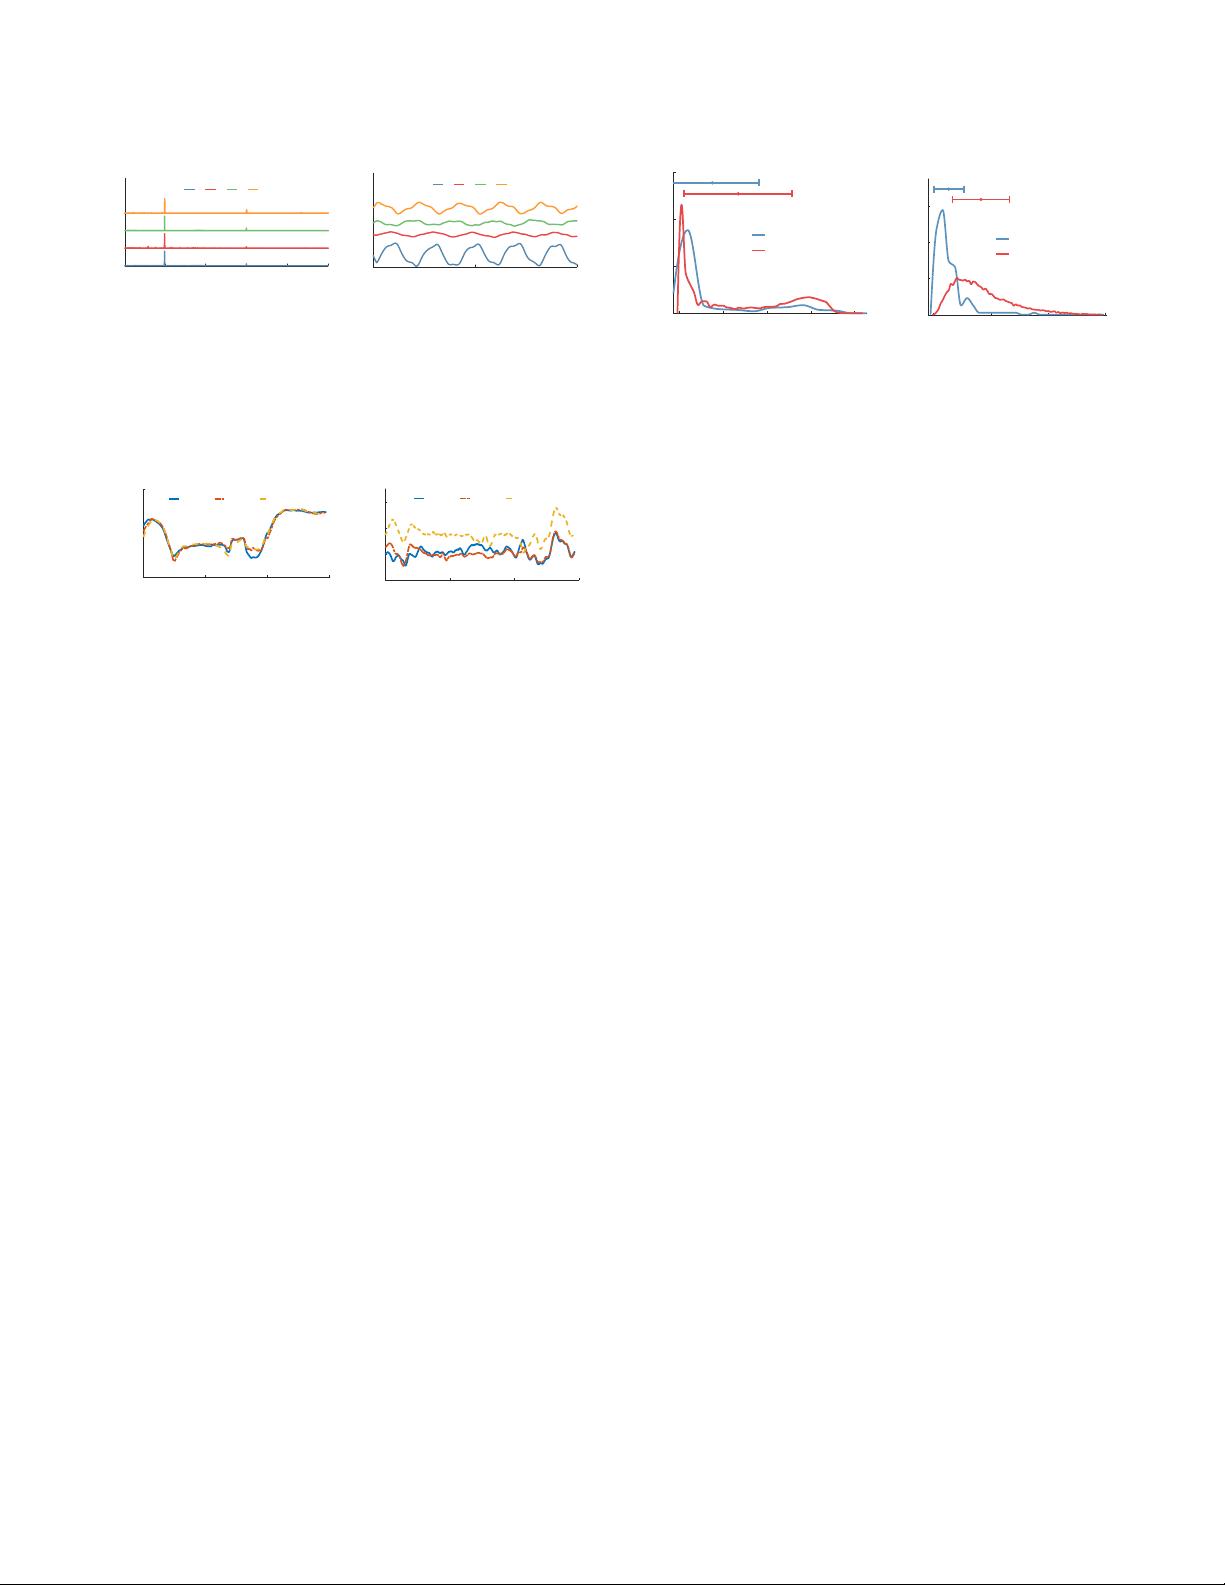
Figure 4: Time/frequency Characteristics. (a) Power
spectral density. (b)
100
ms signal snippets. The curves
in the gures are vertically displaced for better visual
comparison among them.
0 50 100 150
Distance (m)
-40
-20
0
EMF (dBFS)
158cm 173cm 188cm
(a)
0 50 100 150
Distance (m)
30
40
50
60
Magnitude (uT)
158cm 173cm 188cm
(b)
Figure 5: Power network EMF’s invariability and geo-
magnetic eld’s variability with user height. (a) Power
network EMF. (b) Geomagnetic eld.
can see that they have similar characteristics, i.e., the sensed
signal consists of a 50
Hz
major component and several har-
monics. Fig. 4(b) shows the 100
ms
snippets of the sensed
signals at the four locations in the same time duration. The
power network EMF intensities at dierent locations have
distinct waveforms and amplitudes. This distinctness is con-
sistent with our understanding, as power network EMF has
a spatial distribution. As discussed in §2.1, this distribution
mainly depends on the routing of the powerlines. As the pow-
erline routing usually stays xed, the spatially distributed
power network EMF is promising for location sensing.
Invariability with User Height:
The spatial distinctive-
ness of indoor geomagnetic signals has been studied [
8
,
15
].
Power network EMF and geomagnetic eld are dierent. Ge-
omagnetic eld is the magnetic eld that extends from the
Earth’s interior out into space. Due to the metal infrastruc-
ture in the buildings, geomagnetic eld is distorted in indoor
environments and can be utilized as the location signature.
Geomagnetic intensity is static over time. In contrast, the
power network EMF emitted from the ac powerlines is a
time-varying eld. Our following measurements show that,
compared with the geomagnetic eld, the power network
EMF exhibits better invariability with user height.
We recruit three users with dierent heights (158cm, 173cm,
and 188cm) who carry our powerline EMR sensor and a
smartphone, and walk in a 150-meter pathway in a building.
0 10 20 30 40
Distance
0
0.1
0.2
0.3
PDF
Same Position
Different Position
(a) 1-step window size.
0 100 200 300
Distance
0
0.01
0.02
0.03
PDF
*
Same Position
Different Position
(b) 9-step window size.
Figure 6: Distributions of DTW distance between two
power network EMF RMS segments at the same or dif-
ferent locations.
Fig. 5 shows the root mean square (RMS) value measured
by our powerline EMR sensor and the geomagnetic magni-
tude measured by the phone’s 3-axis magnetometer. Each
RMS value is computed based on readings in a 20
ms
win-
dow. Though both sensing modalities are aected by the
sensor altitude, the geomagnetic sensing is apparently more
susceptible as the envelope of the geomagnetic magnitude
varies much with user height. In contrast, the envelope of
the power network EMF RMS exhibits better invariability
against user height. This result implies that the power net-
work EMF signature map can be constructed based on data
crowd-sourced from users with dierent heights.
Location Discriminability:
This set of experiments inves-
tigates whether we can discriminate dierent locations in
the resolution of footsteps based on power network EMF
measurement traces. A researcher carrying a powerline EMR
sensor and a smartphone walks three loops along the trajec-
tory showed in Fig 3. This trajectory covers all the pathways
in the building. We compute the sensed signal’s RMS trace
and divide it into non-overlap segments, where a segment
corresponds to a footstep sensed by the smartphone’s iner-
tial measurement units (IMUs). As the segments may have
dierent lengths due to varying walking speed and pattern,
we use the dynamic time warping (DTW) to measure the
similarity between any two segments. Fig. 6a shows the dis-
tributions of the DTW distance between any two segments
collected at the same location or dierent locations, respec-
tively. The two distributions largely overlap, suggesting that
the power network EMF RMS with a segmentation window
size of one footstep is not location-discriminative. Dier-
ently, if we segment the power network EMF RMS trace
with a segmentation window of nine footsteps, as shown in
Fig. 6b, the two distributions become less overlapped. This
means that with the 9-step window size, though not ideal,
the location discriminability of power network EMF can be
potentially exploited by SLAM. In §4, we will explain how
the proposed SLAM approach can reliably distinguish the
剩余15页未读,继续阅读

黄_玫_瑰
- 粉丝: 1
- 资源: 15
 我的内容管理
展开
我的内容管理
展开


最新资源
- 新型矿用本安直流稳压电源设计:双重保护电路
- 煤矿掘进工作面安全因素研究:结构方程模型
- 利用同位素位移探测原子内部新型力
- 钻锚机钻臂动力学仿真分析与优化
- 钻孔成像技术在巷道松动圈检测与支护设计中的应用
- 极化与非极化ep碰撞中J/ψ的Sivers与cos2φ效应:理论分析与COMPASS验证
- 新疆矿区1200m深孔钻探关键技术与实践
- 建筑行业事故预防:综合动态事故致因理论的应用
- 北斗卫星监测系统在电网塔形实时监控中的应用
- 煤层气羽状水平井数值模拟:交替隐式算法的应用
- 开放字符串T对偶与双空间坐标变换
- 煤矿瓦斯抽采半径测定新方法——瓦斯储量法
- 大倾角大采高工作面设备稳定与安全控制关键技术
- 超标违规背景下的热波动影响分析
- 中国煤矿选煤设计进展与挑战:历史、现状与未来发展
- 反演技术与RBF神经网络在移动机器人控制中的应用
资源上传下载、课程学习等过程中有任何疑问或建议,欢迎提出宝贵意见哦~我们会及时处理!
点击此处反馈


