图像分割的原理与实践:Qt+OpenCV摄像头图像分割实战
发布时间: 2024-08-10 01:34:02 阅读量: 32 订阅数: 28 

# 1. 图像分割的基本原理**
图像分割是计算机视觉中一项重要的技术,其目的是将图像分解成具有不同属性的多个区域。图像分割的基本原理是将图像中的像素点根据其颜色、纹理、形状等特征进行分组,从而识别出不同的对象或区域。
图像分割算法通常可以分为三大类:
* 基于像素的分割算法:将像素点根据其颜色或灰度值进行分类,例如阈值分割和聚类分割。
* 基于区域的分割算法:将像素点根据其连通性或相似性进行分组,例如区域生长分割和分水岭分割。
* 基于边缘的分割算法:检测图像中的边缘,然后将边缘作为分割边界,例如Canny边缘检测和Sobel边缘检测。
# 2. 图像分割算法
图像分割是将图像分解为不同区域或对象的计算机视觉技术。它广泛应用于目标检测、图像编辑、医学影像分析等领域。本章将介绍图像分割的三大类算法:基于像素的分割算法、基于区域的分割算法和基于边缘的分割算法。
### 2.1 基于像素的分割算法
基于像素的分割算法将每个像素分配给一个特定的类或区域。它们通常基于像素的灰度值、颜色或纹理等特征。
#### 2.1.1 阈值分割
阈值分割是最简单的基于像素的分割算法。它将像素分为两类:高于阈值和低于阈值。阈值通常由用户手动选择。
```python
import cv2
import numpy as np
# 读取图像
image = cv2.imread('image.jpg')
# 灰度化图像
gray = cv2.cvtColor(image, cv2.COLOR_BGR2GRAY)
# 应用阈值分割
threshold = 127
segmented_image = cv2.threshold(gray, threshold, 255, cv2.THRESH_BINARY)[1]
# 显示分割后的图像
cv2.imshow('Segmented Image', segmented_image)
cv2.waitKey(0)
cv2.destroyAllWindows()
```
**逻辑分析:**
* `cv2.threshold()` 函数将灰度图像转换为二值图像,其中高于阈值 `threshold` 的像素设置为 255(白色),低于阈值 `threshold` 的像素设置为 0(黑色)。
* `segmented_image` 变量存储分割后的二值图像。
#### 2.1.2 聚类分割
聚类分割将像素聚类到不同的组中,每个组代表一个不同的区域或对象。K-Means 是聚类分割中常用的算法。
```python
import cv2
import numpy as np
# 读取图像
image = cv2.imread('image.jpg')
# 灰度化图像
gray = cv2.cvtColor(image, cv2.COLOR_BGR2GRAY)
# 应用 K-Means 聚类分割
k = 3 # 聚类中心数量
segmented_image = cv2.kmeans(gray.reshape((-1, 1)), k, None, (cv2.TERM_CRITERIA_EPS + cv2.TERM_CRITERIA_MAX_ITER, 10, 1.0))[1].flatten()
# 显示分割后的图像
segmented_image = segmented_image.reshape(gray.shape)
cv2.imshow('Segmented Image', segmented_image)
cv2.waitKey(0)
cv2.destroyAllWindows()
```
**逻辑分析:**
* `cv2.kmeans()` 函数执行 K-Means 聚类算法,将灰度图像像素聚类到 `k` 个组中。
* `segmented_image` 变量存储分割后的图像,其中每个像素的值表示其所属的聚类组。
### 2.2 基于区域的分割算法
基于区域的分割算法将图像分割为连通区域,每个区域代表一个不同的对象或区域。
#### 2.2.1 区域生长分割
区域生长分割从一个种子点开始,并逐步将相邻像素添加到区域中,直到满足某个停止条件。
```python
import cv2
import numpy as np
# 读取图像
image = cv2.imread('image.jpg')
# 灰度化图像
gray = cv2.cvtColor(image, cv2.COLOR_BGR2GRAY)
# 应用区域生长分割
segmented_image = cv2.watershed(gray, markers=np.zeros(gray.shape, dtype=np.int32), mask=None)
# 显示分割后的图像
segmented_image[segmented_image == -1] = 0
segmented_image = cv2.applyColorMap(segmented_image, cv2.COLORMAP_JET)
cv2.imshow('Segmented Image', segmented_image)
cv2.waitKey(0)
cv2.destroyAllWindows()
```
**逻辑分析:**
* `cv2.watershed()` 函数执行区域生长分割算法,将灰度图像分割为连通区域。
* `markers` 参数指定种子点的位置,`mask` 参数指定分割的边界。
* `segmented_image` 变量存储分割后的图像,其中每个像素的值表示其所属的区域。
#### 2.2.2 分水岭分割
分水岭分割将图像视为地形,其中像素强度代表高度。它使用分水岭算法将图像分割为不同的流域,每个流域代表一个不同的对象或区域。
```python
import cv2
import numpy as np
# 读取图像
image = cv2.imread('image.jpg')
# 灰度化图像
gray = cv2.cvtColor(image, cv2.COLOR_BGR2GRAY)
# 应用分水岭分割
segmented_image = cv2.watershed(gray, markers=np.zeros(gray.shape, dtype=np.int32), mask=None)
# 显示分割后的图像
segmente
```

 百万级
高质量VIP文章无限畅学
百万级
高质量VIP文章无限畅学
 千万级
优质资源任意下载
千万级
优质资源任意下载
 C知道
免费提问 ( 生成式Al产品 )
C知道
免费提问 ( 生成式Al产品 )
0
0
相关推荐

专栏简介
本专栏以 Qt 和 OpenCV 为基础,深入探讨了摄像头图像处理的各个方面。从摄像头图像采集和显示的基本原理到图像增强、图像识别、图像分割、图像融合、图像畸变校正、图像压缩、图像传输、图像存储、图像显示优化、图像处理疑难杂症解决、图像处理高级技术、项目实战、算法优化、框架设计和性能分析,本专栏提供了全面的知识体系。通过深入浅出的讲解和丰富的示例代码,本专栏旨在帮助读者掌握摄像头图像处理的核心技术,构建实时摄像头处理系统,并解决图像处理中的常见问题。无论是初学者还是经验丰富的开发者,都可以从本专栏中受益匪浅。
专栏目录
最低0.47元/天 解锁专栏
买1年送3月
百万级
高质量VIP文章无限畅学
千万级
优质资源任意下载
C知道
免费提问 ( 生成式Al产品 )
最新推荐
【品牌化的可视化效果】:Seaborn样式管理的艺术

# 1. Seaborn概述与数据可视化基础
## 1.1 Seaborn的诞生与重要性
Seaborn是一个基于Python的统计绘图库,它提供了一个高级接口来绘制吸引人的和信息丰富的统计图形。与Matplotlib等绘图库相比,Seaborn在很多方面提供了更为简洁的API,尤其是在绘制具有多个变量的图表时,通过引入额外的主题和调色板功能,大大简化了绘图的过程。Seaborn在数据科学领域得
Keras注意力机制:构建理解复杂数据的强大模型
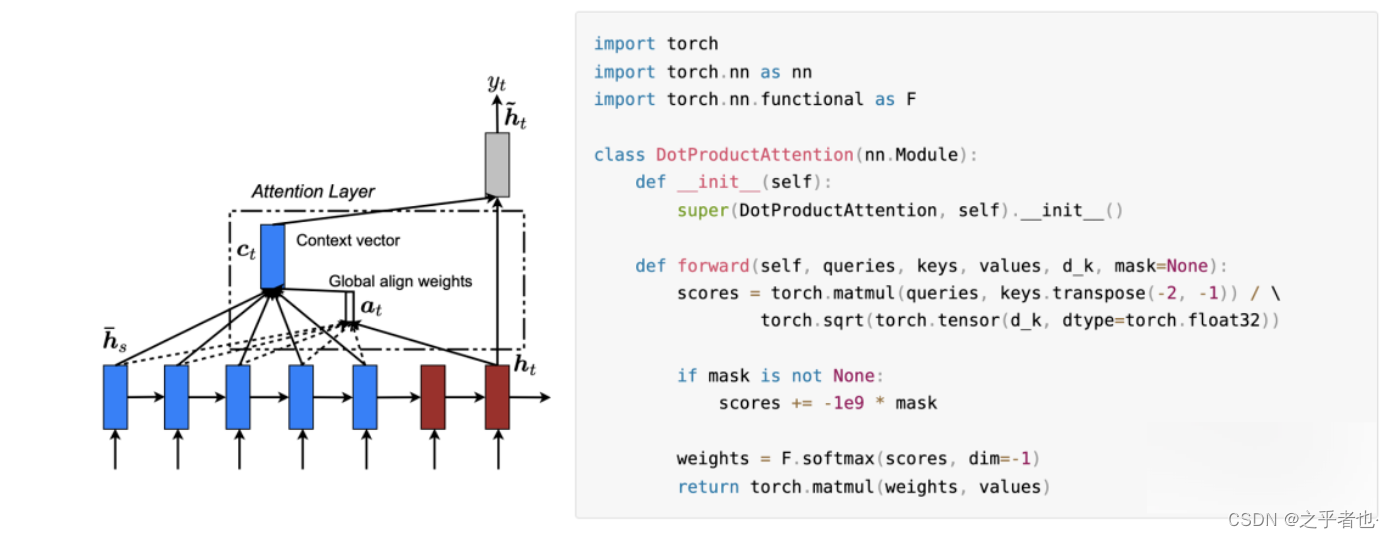
# 1. 注意力机制在深度学习中的作用
## 1.1 理解深度学习中的注意力
深度学习通过模仿人脑的信息处理机制,已经取得了巨大的成功。然而,传统深度学习模型在处理长序列数据时常常遇到挑战,如长距离依赖问题和计算资源消耗。注意力机制的提出为解决这些问题提供了一种创新的方法。通过模仿人类的注意力集中过程,这种机制允许模型在处理信息时,更加聚焦于相关数据,从而提高学习效率和准确性。
## 1.2
Pandas数据转换:重塑、融合与数据转换技巧秘籍
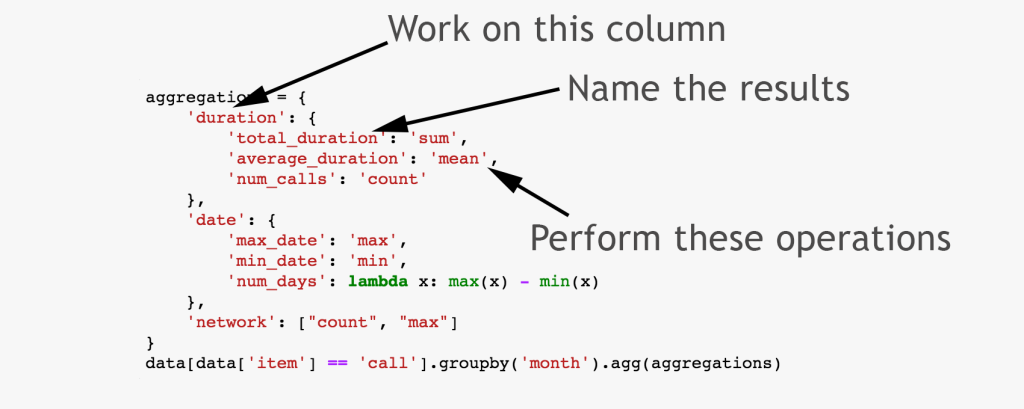
# 1. Pandas数据转换基础
在这一章节中,我们将介绍Pandas库中数据转换的基础知识,为读者搭建理解后续章节内容的基础。首先,我们将快速回顾Pandas库的重要性以及它在数据分析中的核心地位。接下来,我们将探讨数据转换的基本概念,包括数据的筛选、清洗、聚合等操作。然后,逐步深入到不同数据转换场景,对每种操作的实际意义进行详细解读,以及它们如何影响数
数据清洗的概率分布理解:数据背后的分布特性

# 1. 数据清洗的概述和重要性
数据清洗是数据预处理的一个关键环节,它直接关系到数据分析和挖掘的准确性和有效性。在大数据时代,数据清洗的地位尤为重要,因为数据量巨大且复杂性高,清洗过程的优劣可以显著影响最终结果的质量。
## 1.1 数据清洗的目的
数据清洗
NumPy在金融数据分析中的应用:风险模型与预测技术的6大秘籍

# 1. NumPy基础与金融数据处理
金融数据处理是金融分析的核心,而NumPy作为一个强大的科学计算库,在金融数据处理中扮演着不可或缺的角色。本章首先介绍NumPy的基础知识,然后探讨其在金融数据处理中的应用。
## 1.1 NumPy基础
NumPy(N
正态分布与非参数统计:探索替代方法的实用指南

# 1. 正态分布的基本原理及其重要性
## 1.1 正态分布定义
正态分布,也称为高斯分布,是一种在自然科学和社会科学领域广泛出现的概率分布。其特点是对称地围绕均值分布,形状呈现为钟形。具体数学表达为两个参数:均值(μ)和标准差(σ)。
## 1.2 正态分布的重要性
为何正态分布在统计学和数据分析中至关重要?首先,许多
PyTorch超参数调优:专家的5步调优指南
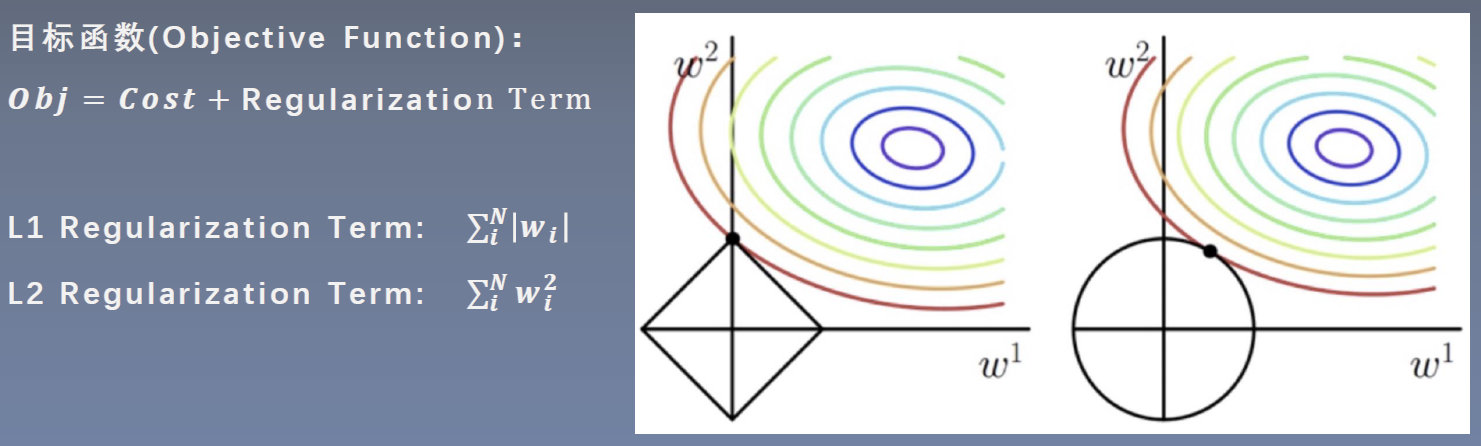
# 1. PyTorch超参数调优基础概念
## 1.1 什么是超参数?
在深度学习中,超参数是模型训练前需要设定的参数,它们控制学习过程并影响模型的性能。与模型参数(如权重和偏置)不同,超参数不会在训练过程中自动更新,而是需要我们根据经验或者通过调优来确定它们的最优值。
## 1.2 为什么要进行超参数调优?
超参数的选择直接影响模型的学习效率和最终的性能。在没有经过优化的默认值下训练模型可能会导致以下问题:
- **过拟合**:模型在
从Python脚本到交互式图表:Matplotlib的应用案例,让数据生动起来

# 1. Matplotlib的安装与基础配置
在这一章中,我们将首先讨论如何安装Matplotlib,这是一个广泛使用的Python绘图库,它是数据可视化项目中的一个核心工具。我们将介绍适用于各种操作系统的安装方法,并确保读者可以无痛地开始使用Matplotlib
【数据集加载与分析】:Scikit-learn内置数据集探索指南
# 1. Scikit-learn数据集简介
数据科学的核心是数据,而高效地处理和分析数据离不开合适的工具和数据集。Scikit-learn,一个广泛应用于Python语言的开源机器学习库,不仅提供了一整套机器学习算法,还内置了多种数据集,为数据科学家进行数据探索和模型验证提供了极大的便利。本章将首先介绍Scikit-learn数据集的基础知识,包括它的起源、
【循环神经网络】:TensorFlow中RNN、LSTM和GRU的实现

# 1. 循环神经网络(RNN)基础
在当今的人工智能领域,循环神经网络(RNN)是处理序列数据的核心技术之一。与传统的全连接网络和卷积网络不同,RNN通过其独特的循环结构,能够处理并记忆序列化信息,这使得它在时间序列分析、语音识别、自然语言处理等多
资源上传下载、课程学习等过程中有任何疑问或建议,欢迎提出宝贵意见哦~我们会及时处理!
点击此处反馈


专栏目录
最低0.47元/天 解锁专栏
买1年送3月
百万级
高质量VIP文章无限畅学
千万级
优质资源任意下载
C知道
免费提问 ( 生成式Al产品 )